To open TCP Flow Analysis window, double-click any item in the conversation list on the TCP Conversation view or right-click any item and select Packet/TCP Flow Details.
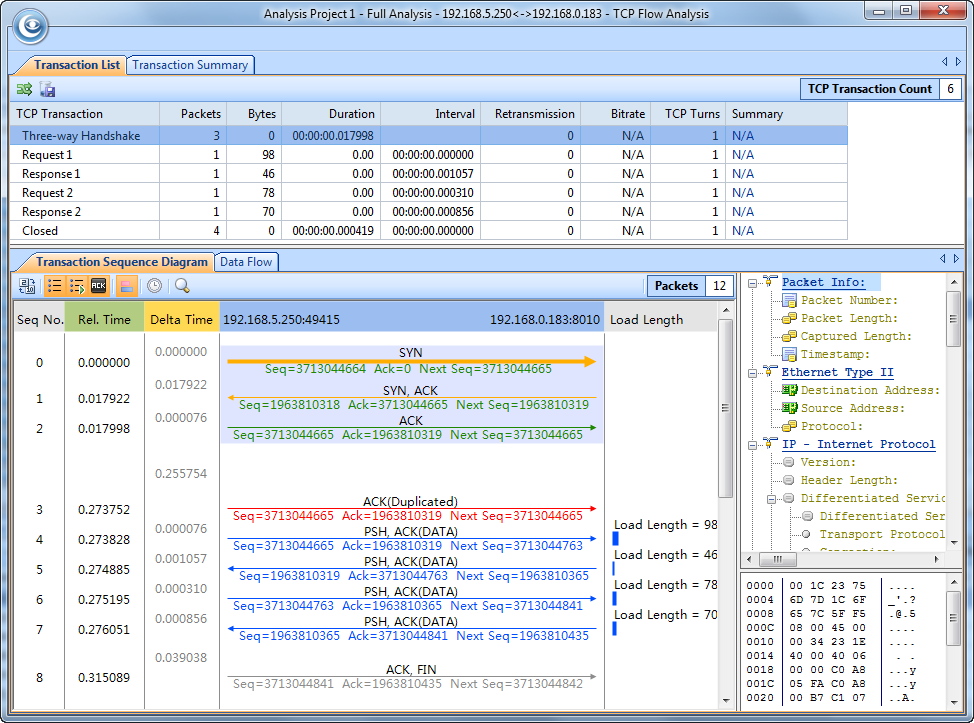
The TCP Flow Analysis window appears as below.

The TCP Flow Analysis window provides detailed transaction information, packet information, and data flow information of the conversation selected on the TCP Conversation view, including two views:
The Transaction List view includes an upper pane which provides transaction list information about the conversation selected on the TCP Conversation view and a lower pane which contains Transaction Sequence Diagram tab and Data Flow tab.
There are only three items on the toolbar of this tab, described as below
| Item | Description |
 |
Reverses the transaction list to reverse between requests and responses. |
 |
Saves the packets of selected transaction in the transaction list. You can save packets in any format selected from the Save as type drop-down list box. |
 |
Shows the number of the transactions. |
The following table lists and describes the columns of Transaction List.
| Column | Description |
| TCP Transaction | Lists the name of a transaction, including Three-way Handshake, Request count, Response count, and Closed. |
| Source | The source of the transaction, including IP address and port number. |
| Destination | The destination of the transaction, including IP address and port number. |
| Packets | The number of packets for the transaction. |
| Bytes | Total bytes of load length which is the size of the data portion of TCP segment. |
| Duration | Duration of the transaction. |
| Interval | The interval between two adjacent transactions. |
| Retransmission | The retransmission times for the transaction. |
| Bitrate | The bitrate of the transaction. Only available when the packet number is greater than or equal to 10. |
| TCP Turns | The times of TCP turns. TCP turn means the number of paired ACKnowledgement packet and packet with data portion, plus1 when there is a packet with data portion at the tail of a transaction. TCP turn will be 1 when there is only one pair of adjacent ACKnowledgement packets. There are at least one TCP turn in one transaction. |
| Start Time | The time when the transaction started. |
| End Time | The time when the transaction ended. |
| Summary | Summary for the transaction. |
When a specific transaction is selected, the Transaction Sequence Diagram tab will auto-scroll to display corresponding transaction information in diagram type.
When a transaction item is selected on the transaction list, the Transaction Sequence Diagram will display corresponding packet information for the transaction with a background color of grey.
On the diagram, one horizontal line with arrow represents one packet and the arrow represented the direction of the packet. The green lines represents packets of Three-way Handshake, the blue ones represent packets with application data, the yellow ones represent ACKnowledgement packet, and the red ones represent packets with something wrong, lick retransmission, repeated ACKnowledgement and so on.
Click an arrow, the arrow becomes thick yellow and the right section will display the decoding information of the packet.
The following table lists and describes the buttons on the toolbar of this tab:
| Item | Description |
 |
Displays relative packet number from 0 to n or displays real packet number in the project buffer. |
 |
Displays Sequence Number of the packet. |
 |
Displays Next Sequence Number of the packet. |
 |
Displays Ack Number of the packet. |
 |
Displays load length information of the packet. |
 |
Sets relative time for the packets. |
 |
Calls out Find dialog box to search in the packet decoding section on the right. When finding the result, the horizontal line for the packet will be highlighted. |
This tab presents original information of the transaction selected on the transaction list. See Data Flow tab for more information.
![]() You may get unreadable symbols because some data are encrypted in transmission.
You may get unreadable symbols because some data are encrypted in transmission.
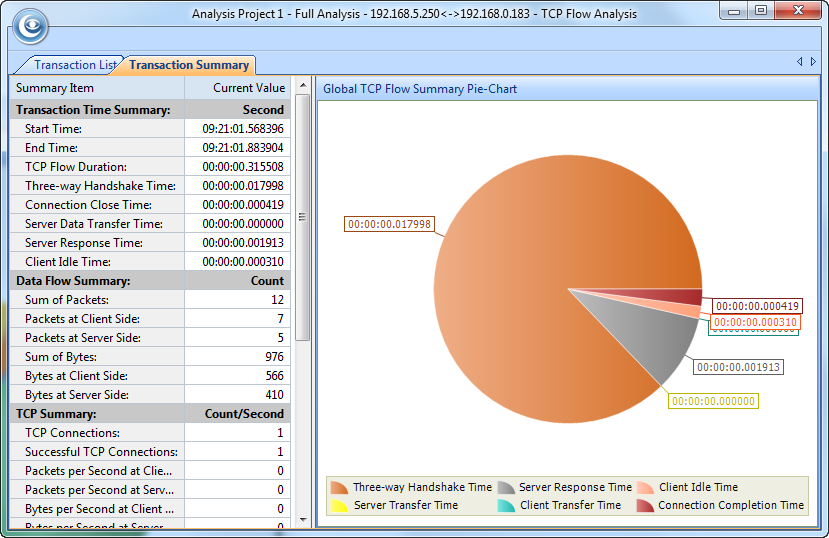
The Transaction Summary view displays TCP transaction statistics on the left pane and related metrics with pie chart on the right pane. The Transaction Summary view appears as below.

The left pane provides statistical items listed as below:
The right pane prevents a pie chart of global TCP flow statistics, including six items on the pie chart: Three-way Handshake Time, Server Response Time, Client Idle Time, Server Transfer Time, Client Transfer Time, and Connection Completion Time, and visually showing the TCP flow time information of the TCP conversation selected on the TCP Conversation view.
| Back |