|
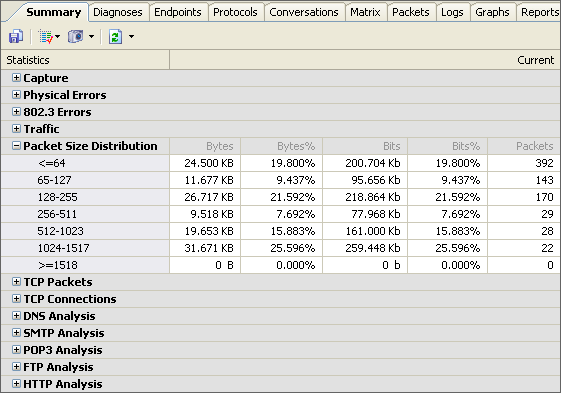
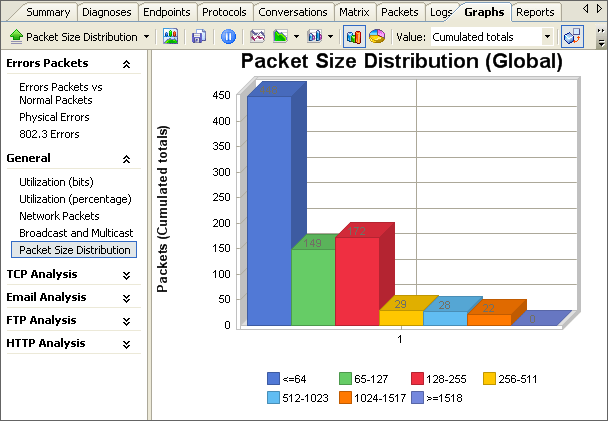
The graphic data in the Graph view and the statistic information in the Summary view are consistent, you can see that from the following figures.
Both the Summary view and Graph view offer statistical data about your network. However, the Summary view only presents the instant statistical data, whereas in Graph view you can see the historical data in a certain time span, e.g. last 120 seconds. Note: By default, Colasoft Capsa only collects the data on intranet nodes continuously, the data collecting on an Internet node are not initiated until you select it. Graphs go with the current node, to get global graphs, you must enable no filter and select the project root node in the Project Explorer dock window. |