|
Unique to Colasoft Capsa enterprise edition.
The Graphs view graphically presents the statistic data of the current node. It contains a number of graph groups and multiple graph titles, including errors vs total packets, network utilization, packet size distribution, packet size details and many more. The available graph titles and display options will vary with the specific node you select from the Project Explorer.
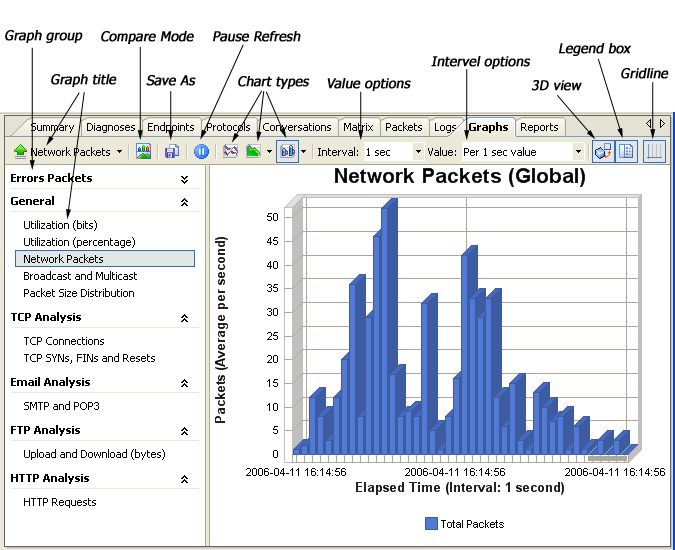
The table below describes each of the parameters used to set up or save a statistic graph.
| Parameter | Description |
| Graph group | Available graphs are grouped by analyzer, each analyzer has one graph group; the General group contains some commonly used statistic graphs, involving multiple analyzers. |
| Graph title | The title of the graph. |
| Save As | Saves the graph to a *.bmp, *.emf and
*.png file. |
| Pause Refresh | Temporarily halts refreshing the display. |
| Chart types | The chart types which are available for the current node and the selected graph title. |
| Value | Selects a value type to see the graphic data. |
| Interval | Selects a scale to set the refresh and sampling interval. |
| 3D view | Shows the graph in three-dimensional view. |
| Legend box | Shows or hides the explanation of the colors appearing on the graph. |
| Gridline | Shows or hides the gridlines on the graph. |
For more information, please see the "Graphs" chapter. |