|
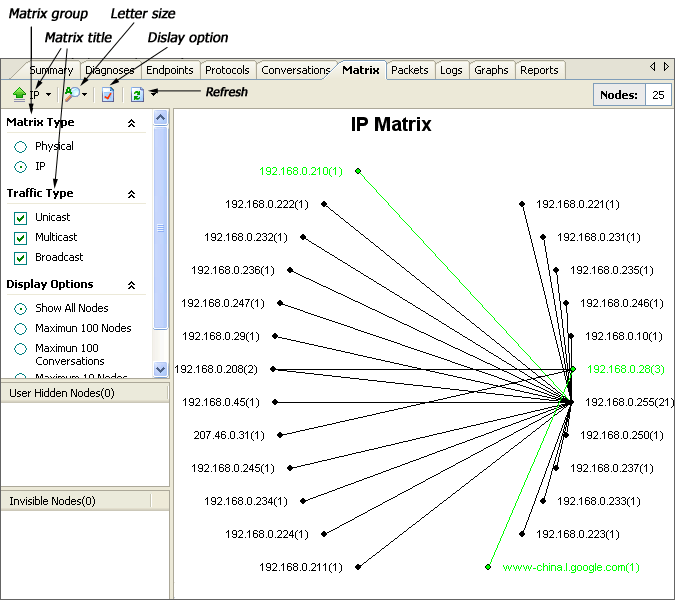
The Matrix view shows the network traffic statistics. The line weight indicate the volume of traffic between nodes arranged in an extensive ellipse indicate the traffic. You can quickly switch among global statistics and the details of specific network nodes by switch the corresponding nodes in the Project Explorer. There will no data displayed in this view if open a project file or packet file of version 5.5 or before.
The table below describes each of the parameters used to set
up or save a statistic matrix.
For more information, please see the "Matrix" chapter. |
