Colasoft Ping Tool is a powerful graphic ping tool, it supports ping
multiple IP addresses at the same time, and compares response time in a
graphic chart. You can view historical charts and save the charts to a
*.bmp file. With this tool, users can ping the IP addresses of captured
packets in Colasoft Capsa conveniently, including resource IP,
destination IP or both of them.
There are four ways to invoke Colasoft Ping Tool:
- Click the Colasoft Ping Tool command in the Tools
menu.
- Select a packet in the Packets view or a node in the
Project Explorer, right-click and choose the Ping command
from the context menu (if applicable).
- Open the Start button of Windows and choose All
Programs. Click the Colasoft Ping Tool from the Colasoft
Capsa application.
- Choose the Run… command from the Start button of
Windows, input Cping.exe command and click the Enter key.

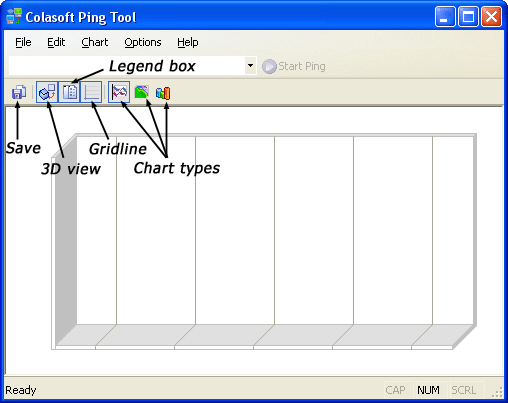
In the toolbar, there are some quick button let you can custom the
type of graph.
| Button |
Description |
| Save |
Saves the graph to a *.bmp file. |
| 3D view |
Shows the graph in three-dimensional view. |
| Legend box |
Shows or hides the explanation of the colors appearing on
the graph. |
| Gridline |
Shows or hides the gridlines on the graph. |
| Chart types |
The chart types which are available for the current node and
the selected graph title. |
Enter an IP address and click the Start
 button, stop the execution after a while.

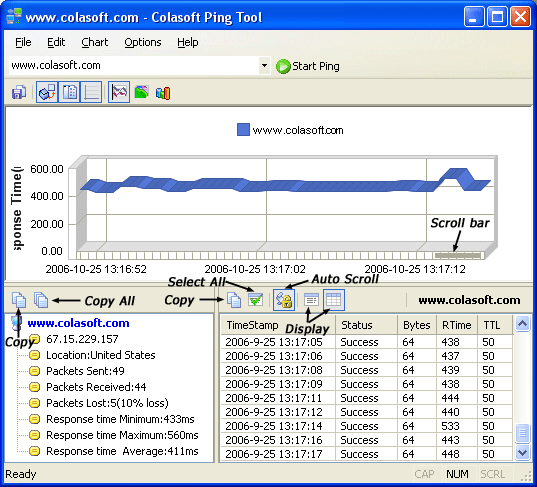
Colasoft Ping Tool displays the operation and the statistic results
of ping with three windows.
- Graphic window
The upper window reveals every ping command in graphic way, used for
viewing the secular trend in Ping time. The X axes indicates the
Ping real time, the Y axes reveals the Ping response time in ms.
Moves the scroll bar in the graph to view historical graph.
- Ping - Summary
The Ping - Summary window lists all required IP addresses or domain
names with its summary, such as IP address, location, packets
Sent/received/lost and response time.
- Ping - Details
The Ping - Details window displays the details information of ping
execution. When you select an IP address or a domain in the Ping -
Summary window, the Ping - Details window will display the corresponding
results. There are two kinds of display type classical and list. The
classical view is same to the output of
windows ping. While, the list view used the display format of
Colasoft own, such as TimeStamp (in second), Status, Bytes, ResponseTime
(in millisecond) and TTL.
ResponseTime is the real time of local host receives the destination
response.
The buttons in the Ping - Summary and Ping - Details window:
| Button |
Description |
| Copy |
Copies the selected domain's summary information and puts it
on the clipboard. |
| Copy All |
Copies the all domains' summary information and puts it on
the clipboard, if ping more than one address. |
| Copy |
Copies the selected item in the details window and puts it
on the clipboard. |
| Select All |
Select all items listed in the details window. |
| Auto Scroll |
The details list will display the newest packet always if
check this button. |
| Display |
Shows the details in classical view, Windows display type,
or list view. |
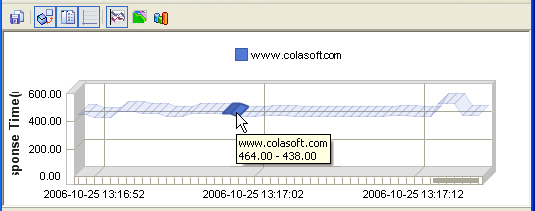
For a clear view, please move your mouse cursor to the graph.
Colasoft Ping tool will highlight the specific node and node border upon
it. An annotation will automatically popup which contains the domain
name and response time. The response time in the annotation will be a
range of time when your mouse cursor puts on the grid, while it will be
a time if your mouse cursor puts on the grid line.

|
