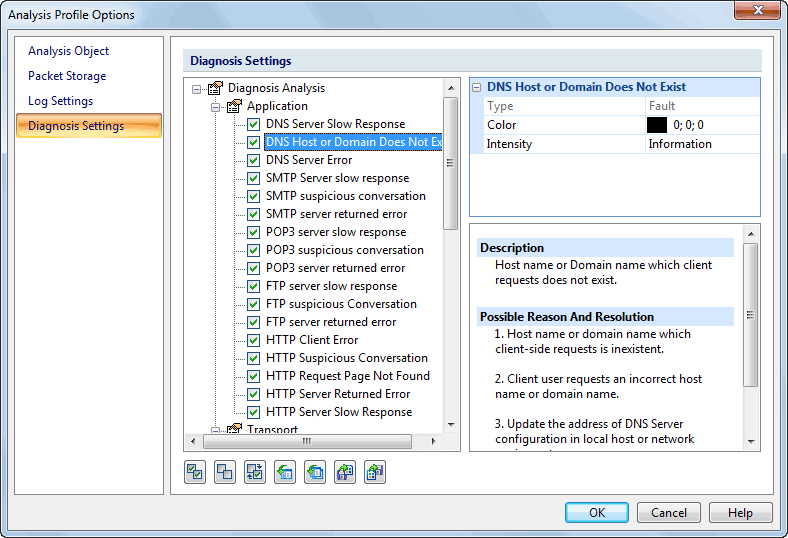
This page lists all available diagnosis events of the loaded analysis module of the current analysis project. You can read the Description and the Possible Reason of an event in the right pane to help you solve a network problem when you selected any diagnosis event in the events list. The settings: Color, Severity Level and some other parameters (if applicable) can be customized.
You can read Analysis Profile to learn how to open the Diagnosis settings window.
All diagnosis events are hierarchical grouped in protocol layers: Application Layer, Transport Layer, Network Layer and Data Link Layer. You can easily find which layer a network problem comes from.

In left pane, what diagnosis event items you see depend on what analysis modules loaded in the current project. You can uncheck a diagnosis event item to disable it and you will not see this diagnosis event in the Diagnosis tab of the Main View.
You can highlight a diagnosis item on the left pane and customize its settings on the top-right pane. Different diagnosis items have different settings. The general settings are listed below:
Click a diagnosis item, you will see its Description and Possible Reason on the bottom-right pane to get more information about the selected diagnosis item.
There are seven buttons on the bottom of this window to help you manage all your diagnosis events.
|
Back |
| Copyright © 2001 - 2010 Colasoft. All rights reserved. |