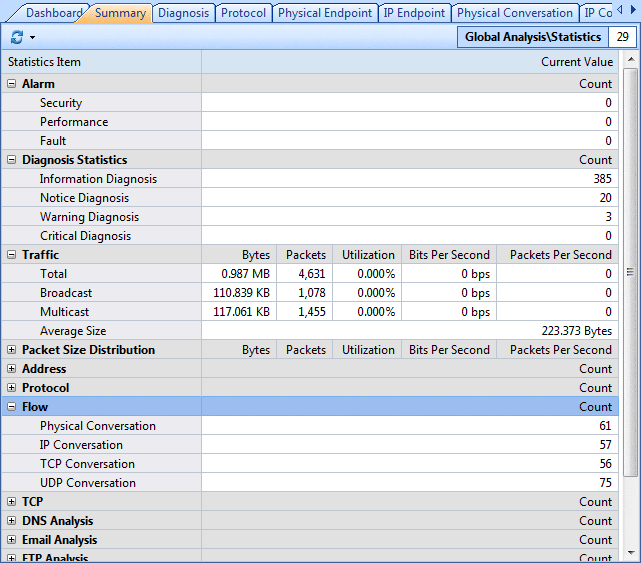
Associated with your selection in the Node Explorer window, the Summary tab provides general statistics on the selected node. When you select the root node, you can get the statistics on your global network; if you select a specific node, it will present the particular information of the chosen node. The Summary tab is described as follows:

This tab refreshes every ten seconds by default. You can click the refresh icon (on the top-left corner of this tab) to refresh or to set refresh options. You can either choose Manual Refresh or set an automatic refresh time.
By selection a node in Node Explorer window, the Summary tab refreshes automatically. Different selections result in different statistic items. The following table lists all the statistic items you will see in the Summary tab.
| Item | Description | Abnormal Causes |
| Alarm | Statistics on the number of the three types of triggered alarms. | Anomalies occurred: check the Alarm Explorer window for details. |
| Traffic | Statistics on throughput of total, broadcast and multicast traffic of a node or the whole network. |
|
| Packet Size Distribution | Statistics on the packet sizes of captured packets. | Large portion of traffic at <=64 or >=1518: fragment attack or flood attack. |
| Address | Statistics on the number of MAC address, IP address, local address and remote address. | Abnormal too big number: MAC flooding attack, TCP flooding attack, etc. |
| Protocol | Statistics on the number of protocols used in communication. | |
| Flow | Statistics on physical, IP, TCP and UDP flows. | |
| TCP | Statistics on TCP connection packets. | Large number of TCP SYN packets: port scanning (TCP SYN flooding attack). |
| DNS Analysis | Statistics on DNS queries' request and response. | |
| Email Analysis | Statistics on SMTP and POP3 connection. | Large number of connections: Worm |
| FTP Analysis | Statistics on FTP uploading and downloading. | |
| HTTP Analysis | Statistics on web browsing communication. |
|
Back |
| Copyright © 2001 - 2010 Colasoft. All rights reserved. |