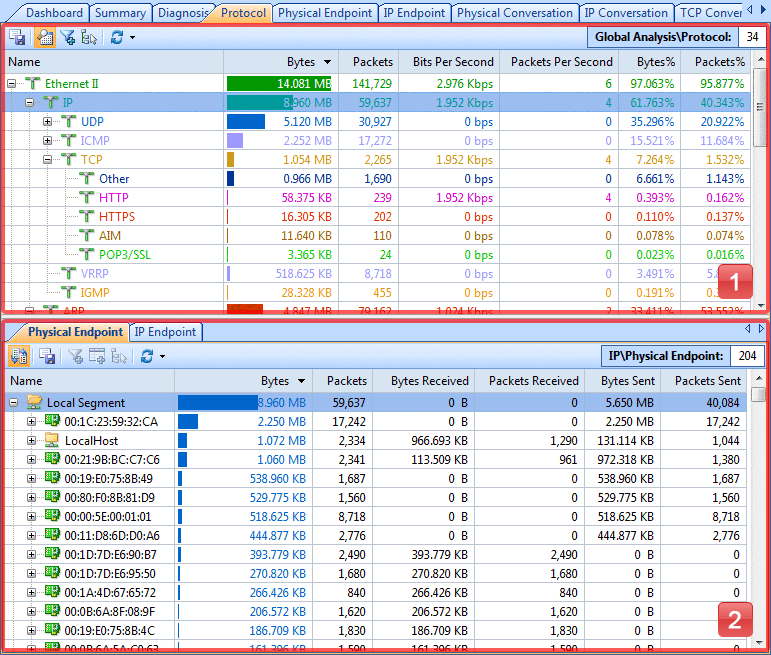
 Upper Pane (Protocol List)
 Lower Pane (Relating tabs)
The Protocol tab displays the statistics on protocols used by network communications. It contains the following components:

Protocols are displayed in a hierarchical structure as their original packaging orders that help you figure out their upper protocols. Each protocol has its own color that you can easily find out your target protocol in the list by color. You can click any column header to sort the list to check if there is any abnormal protocol usage. The Protocol List contains the following items:
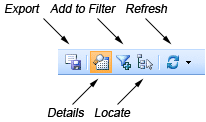
The following table lists all the items on the toolbar:

| Export | Click to export all of the protocol statistics to a *.txt format file. |
| Details | Click to show or hide the lower pane. |
| Add to Filter | Click to open the Packet Filter dialog box to make a new filter based on the selection in this pane. |
| Locate | Click to locate the current protocol node in the Node Explorer window. |
| Refresh | Click to refresh the protocol list or set the refresh options. |
| Protocol Counter | Shows the number of all protocols in the list. |
Right-click a column header, you can select more columns to show in the list. Choose Default to get showing columns back to default.

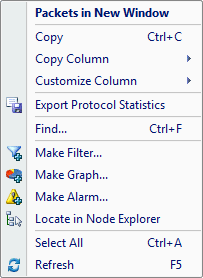
The following table lists all the menu items in the list:
| Packets in New Window | Sends the packets to a new packet decode window. |
| Copy | Copies the selection in original format to the clipboard. |
| Copy Column | Copies the selected column in original format to the clipboard. |
| Customize Column | Shows/ hides columns or changes the position of columns. |
| Export Protocol Statistics | Saves all of the protocol statistics to a *.txt format file. |
| Find... | Finds an item in the tab. |
| Make Filter... | Opens a new dialog box to make a new filter on the basis of the selection. |
| Make Graph | Generates a new graph item in the Dashboard tab based on the selected item. |
| Make Alarm | Generates a new alarm item based on the selected item. |
| Locate in Node Explorer | Locates the current node in the Node Explorer window. |
| Select All | Selects all items in the list. |
| Refresh | Refreshes the current list. |
What tabs show in the bottom pane depend on what you selected in the Node Explorer window. These tabs provide the most relating statistics to your selection. For example, you will have IP Conversation, TCP Conversation and UDP Conversation tabs when you selected an IP address in the Node Explorer window. Your selection in the Node Explorer window and the selection in the protocol list will be like filters to get more small items in the bottom tabs. These tabs will save your time and clicks to find the statistics you need.
Read the corresponding tab introduction to learn how to use these tabs.
|
Back |
| Copyright © 2001 - 2011 Colasoft. All rights reserved. |