Creating Graphs
You may want to view specific statistics graphically, and Capsa provides you two types of graphs (See Graph types for details).
You can customize statistical graphs based on from global network to a specific node, including an MAC address, an IP address and a protocol.
To open the Make Graph dialog box to create a graph, you can perform one of the following operations:
- Click
 on the top-right corner of every dashboard panel.
- Click the link Click here to add a new chart on the dashboard panel.
- Click
 icon in the Node Explorer window.
- Choose Make Graph on Pop-up menu which are available for the Node Explorer window and all statistical views except Dashboard, Summary, Matrix, and Report views.

- Graphs that are created by the first two methods above show the statistics of all packets captured by the analysis project.
- Graphs that are created by the last two methods above show the statistics of the packets about the node which you right-clicked or which you selected in the Node Explorer window.
For example, when you want to view the total traffic status of a specific network segment in a graph, you should first locate the segment in the Node Explorer window, right-click the segment and choose Make Graph, and then check Total in the Traffic list.
The Make Graph dialog box appears as follows:
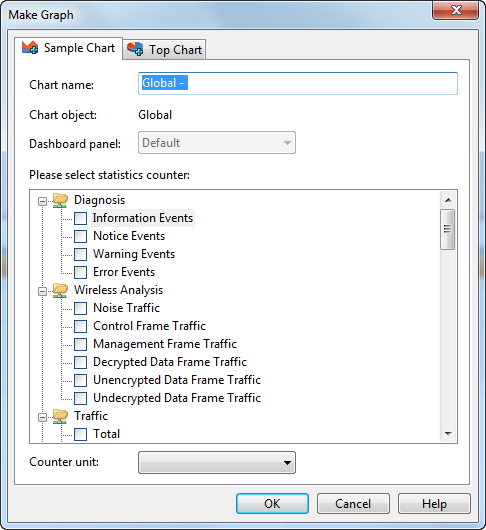
The Make Graph dialog box contains two tabs: Sample Chart and Top Chart, both including the following items:
- Graph Name: The name of the graph, which can be automatically generated or defined by users.
- Graph Object: Showing the statistical object of the graph, which is defined by the program.
- Dashboard Panel: For you to choose the dashboard panel for managing the graph and listing all created dashboard panels on the combo box.
- Statistics Counters: Showing all available statistical items, which are changed along with the Graph Object.
- Counter Unit: Showing the unit for the Statistics Counters.