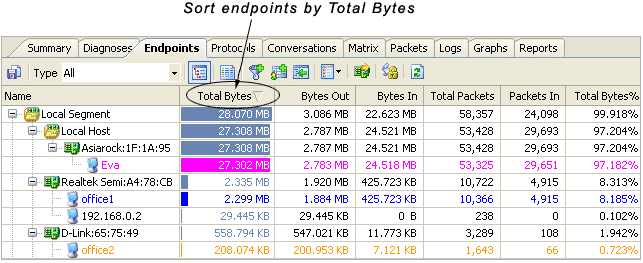
Colasoft Capsa has nine tab views, each focusing on different network
information. The table below offers the main usage of these views.
| Tab View | Description |
| Summary | Presents the summary statistics of global network or specific network nodes. |
| Diagnoses | Presents the diagnosis events of global network or specific network nodes. |
| Endpoints | Categorizes and displays network traffic by hierarchical endpoints, physical endpoints, or IP endpoints. |
| Protocols | Categorizes and displays network traffic by protocol. |
| Conversations | Shows the Physical, IP, TCP
and UDP conversations between pairs of endpoints, the reconstruction of TCP streams is available. |
| Matrix | Shows the network traffic between two
nodes in real time. The nodes were arranged in an elongated
ellipse and lines between communicating nodes indicate the
traffic. |
| Packets | Shows a list of captured packets in the order they were received and offers the detailed information of packet decode. |
| Logs | Records the network communications of email messages, HTTP requests, FTP transfers, DNS analysis,
MSN activities, AIM activities, ICQ activities and Yahoo
Messenger activities. Primarily from any enabled advanced analyzers. |
| Graphs | Presents a variety of graphs displaying network statistics in real time, based on the node you select from the Project Explorer dock window and consistent with the Summary view. You can use the Compare Mode to view two different graphs simultaneously. |
| Reports | Displays the real time statistics of
summary statistics, diagnosis events and top 10 addresses, and
all available graphs. |
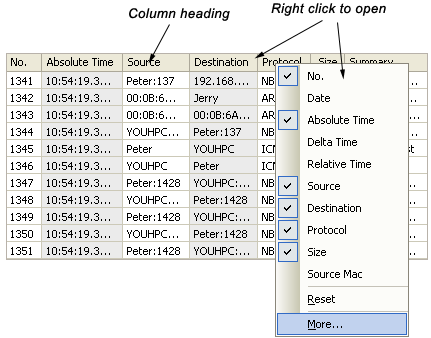
Each tab view (except the Graphs view, Matrix view and
Reports view) has its own column/sub-column options, you can right click on the column heading bar and select more columns to display. In the Endpoints view, Protocols view and Conversations view, with a click or double clicks on a column heading, you can sort the data in this column by ascending or descending, which helps you easily find the source of top traffic.
 You can
switch among various views to see different packet information of a specific node by first selecting the node from the Project Explorer dock window. If you find a suspicious item in a tab view, the Locate Explorer Node command in the context menu (except the Summary
view, Graphs view and Reports view) is able to let you find and highlight its location in the Project Explorer dock window by IP address, physical address or protocol, and at the same time, other tab views accordingly display the relevant information of this node.
The columns showed in tab views can be customized, you may show/hide specific columns or change the position of a column, please see "Columns" for more descriptions.

The following is the common commands contained in the context menu of tab views, which can be opened with a right click in anywhere of a tab view. The particular context commands of each view are described in the sections below.
| Command | Description |
Applicability |
| Copy (Ctrl+C) | Copies the selection as a text file and puts it on the clipboard. |
All tab views except Graphs view, Matrix view,
Reports view. |
| Copy Column | Copies the selected column as text and puts it on the clipboard. |
Diagnoses view, Endpoints view, Protocols view, Packets view, Conversations view, Logs view. |
| Custom Columns | Shows/hides columns or changes the position of columns. |
Diagnoses view, Endpoints view, Protocols view, Packets view, Conversations view, Logs view. |
| Find | Finds an item in the view. |
Endpoints view, Protocols view, Packets view, Conversations view, Logs view. |
| Locate Explorer Node | Locates the current node in the Project Explorer. |
Diagnoses view, Endpoints view, Protocols view, Packets view, Conversations view,
Matrix view, Logs view. |
| Make Filter... | Opens the Packet Filter dialog and makes a new filter on the basis of the selection. |
Diagnoses view, Endpoints view, Protocols view, Packets view, Conversations view,
Matrix view, Logs view. |
| Add to Name Table | Adds or edits an alias. See "Name Table" for more descriptions. |
Diagnoses view, Endpoints view, Packets view, Conversations view,
Matrix view, Logs view. |
| Select All | Selects all items. |
All tab views except Graphs view, Matrix view,
Reports view. |
| Refresh | Refreshes the current view. |
All tab views except Graphs view. |
|

