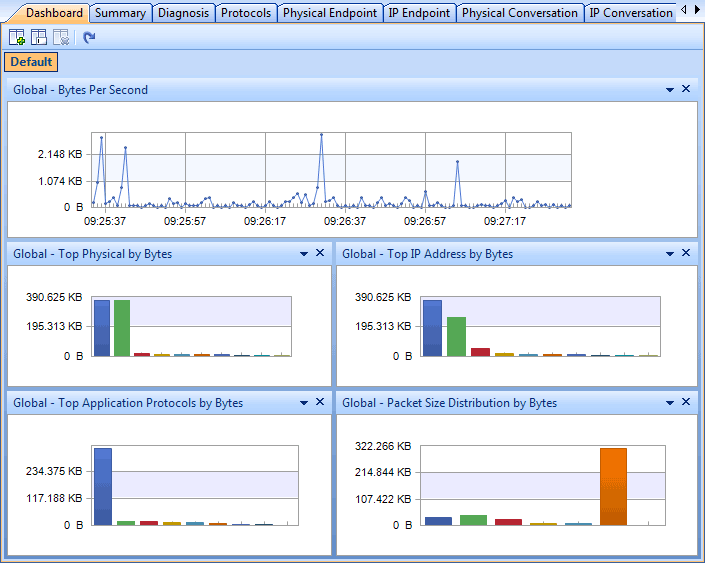
The Dashboard tab is a new feature of Colasoft Capsa (visible only when the analysis profile root in the Node Explorer window selected). It provides a great many of statistic graphs from global network to a specific node. You are able to as well create almost any kind of graph based on any MAC address, IP address and protocol, etc. With these graphs, you can easily find out anomalies of the network and get useful statistics.

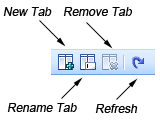
The Dashboard tab contains the following components:
By default, there are five graphs provided. Graphs take a lot of space and too many graphs in a single page will make the tab very crowded and hard to view. Therefore, Colasoft Capsa allows you to organize graphs in different tabs to get a better view.

The pop-up menu contains the following items:
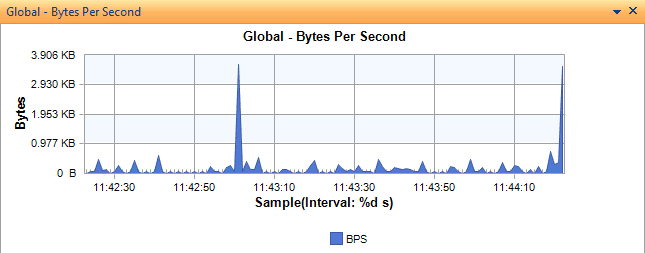
The display items are described as figure below:

Graph positions are changeable. You can click and drag the head of a graph to rearrange its position go get a better view.
You can read Creating Graphs to learn how to create a graph in the Dashboard tab.
| Back |
| Copyright © 2001 - 2010 Colasoft. All rights reserved. |