 Diagnosis Layer
 Diagnosis Address
 Events
The Diagnosis tab presents the real-time diagnosis events of global network by grouping them to protocol layers or security level. Colasoft Capsa diagnoses your network from the captured packets and lists all diagnosis events. In this tab, All diagnosis events are sorted by network layers. You can get more information on happening IP address, MAC address, detailed descriptions and possible reasons for the highlighted diagnosis event.
The Diagnosis tab contains three panes:
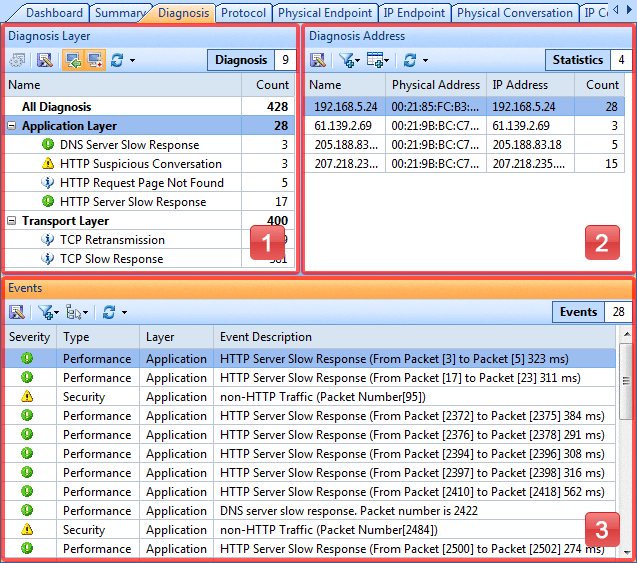
A diagnosis event occurred, it is organized to its corresponding network layer. Choose one event item, other three panes refresh to show statistics and information to it. The Diagnosis Addresses pane lists out all the IP addresses and Physical Addresses that relating to the selected diagnosis event.
 Click Only Instance, only the events with records will be listed. Click again to bring them back.
All events are grouped into protocol layers or security levels. Protocol Layers are Application, Transport, Network and Data Link layer. Security levels are listed in the table below:
| Severity Level | Icon | Description |
| Information | Indicates a normal message, no corrective action is required. | |
| Notice |  |
Indicates normal but significant conditions, may require special handling. |
| Warning | Indicates an error condition that requires attention and should be addressed soon. | |
| Critical | Requires immediate intervention by administrators to prevent serious problem to the network. |
Different analysis profiles may have different items in Diagnosis Events List, for more details, see Application Layer, Transport Layer, Network Layer and Data Link Layer.
The buttons of the toolbar are listed in the following table.
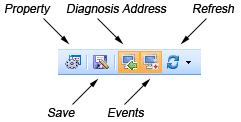
| Property | Opens Diagnosis Settings dialog. |
| Save | Saves all of the diagnosis events to a *.txt format file. |
| Diagnosis Address | Hides/shows the Diagnosis Address pane. |
| Events | Hides/shows the Events pane. |
| Refresh | Click to refresh the protocol list or set the refresh options. |
The following table lists all the items in the menu of the Diagnosis Layer:
| Copy | Copies the selection in original format to the clipboard. |
| Export Diagnosis Statistics... | Saves all of the addresses to disk as a *.txt format file. |
| Diagnosis Address | Saves all of the diagnosis events to a *.txt format file. |
| Events | Hides/shows the Events pane. |
| Diagnose Property... | Opens Diagnosis Settings dialog. |
| Select All | Selects all items in the list. |
| Refresh | Refreshes the current list. |
This pane displays all the addresses, e.g. IP addresses and MAC addresses in this pane.
The buttons of the toolbar are listed in the following table:
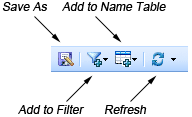
| Save As | Saves the records to your disk as a *.txt format file. |
| Add to Filter | Opens a new dialog to make a new filter on the basis of the selection. |
| Add to Name Table | Add an alias for the selected node to the Name Table. |
| Refresh | Click to refresh the protocol list or set the refresh options. |
The following table lists all the items in the menu of Diagnosis Address:
| Find... | Finds an item in the list. |
| Copy | Copies the selection in original format to the clipboard. |
| Save Log... | Saves all of the addresses to disk as a *.txt format file. |
| Address Resolve... | Resolves the host name of your selected address item. |
| Make Filter | Opens a new dialog to make a new filter on the basis of the selection. |
| Add to Name Table | Add an alias for the selected node to the Name Table. |
| Make Graph | Generates a graph in the Dashboard tab based on the selected item. |
| Make Alarm | Generates an alarm item based on the selected item. |
| Locate in Node Explorer | Locates the current node in the Node Explorer window. |
| Select All | Selects all items in the list. |
| Refresh | Refreshes the current list. |
Displays the following columns by default: Severity, Type, Layer, Event Description, Node 1 and Node 2. You can go further analysis on records listed in this tab.
The buttons of toolbar are listed in the following table:
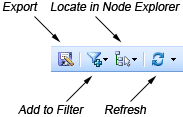
| Export | Saves the records to your disk as a *.txt format file. |
| Add to Filter | Opens the Packet Filter dialog and makes a new filter on the basis of the selection. |
| Locate in Node Explorer | Locates the current node in the Explorer. |
| Refresh | Refreshes the current view. |
| Event Counter | Sums up the total number of records in the tab. |
The following table lists all the items in the menu of Event pane.
| Packets in New Window | Opens a new window to show packet decode information; alternately, you can double click on the packet. |
| Copy | Copies the selection in original format to the clipboard. |
| Save Log... | Saves all of the addresses to disk as a *.txt format file. |
| Find... | Finds your entry word in the tab. |
| Address Resolve... | Resolves the host name of your selected item. With the resolved name, you can easily find the machine in your network. |
| Make Filter | Opens a new dialog to make a new filter on the basis of the selection. |
| Add to Name Table | Add an alias for the selected node to the Name Table. |
| Make Graph | Generates a new graph item in Graph tab based on the selected item. |
| Make Alarm | Generates a new alarm item in Alarm Explorer window to alert you anomalies, based on the selected item. |
| Locate in Node Explorer | Locates the current node in the Explorer. |
| Select All | Selects all items in the list. |
| Refresh | Refreshes the current list. |
You can double-click a packet item to examine packet decoding information in a new window (See Packet Tab for details) or click Show Decode and Show Hex to show Decoder pane and Hex pane to view decoding information.
|
Back |
| Copyright © 2001 - 2010 Colasoft. All rights reserved. |