How to Monitor Network Traffic
As a network analyzer (aka. packet sniffer & protocol analyzer), Capsa makes network monitoring and analysis easy for us with its intuitive and information-rich tab views. With the great network monitoring capacity of Capsa network analyzer, we can quickly identify network bottleneck and detect network abnormities. This article is to show you how to monitor network traffic with Capsa's network analyzer.
Network traffic monitoring in the Dashboard tab
If we want to have a graphical view of the statistics or get a trend chart of the network traffic, then we can use the graphs in the Dashboard tab. It provides a great many of statistic graphs from global network to a specific node. You are able to as well create almost any kind of graph based on any MAC address, IP address and protocol, etc. With these graphs, you can easily find out anomalies of the network and get useful statistics.
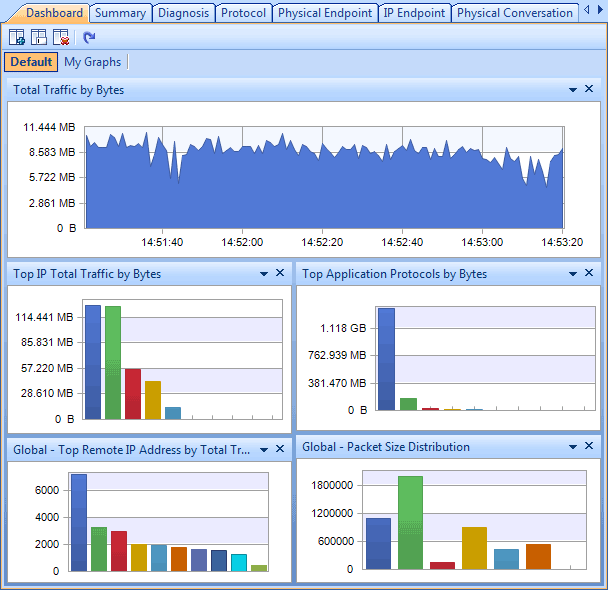
Figure 1: monitor network traffic in the Dashboard tab
Network traffic monitoring in the Summary tab
The Summary tab provides general information of the entire network or the selected node in the Node Explorer window. In the Summary tab we can get a quick view of the total traffic, real-time traffic, broadcast traffic, multicast traffic and so on. When we switch among the node in the Node Explorer window, corresponding traffic information will be provided.
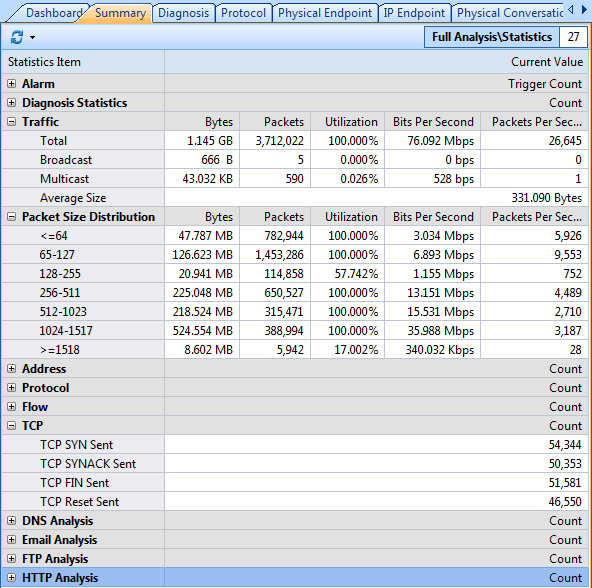
Figure 2: monitor network traffic in the Summary tab
Network traffic monitoring in the Physical Endpoint and IP Endpoint tabs
In these two endpoint tabs (Physical Endpoint and IP Endpoint), we can monitor network traffic information of each physical address node and IP address node, both local and remote. With their easy sorting feature we can easily find out the nodes with abnormal traffic, such as which hosts are generating or have generated the largest traffic.
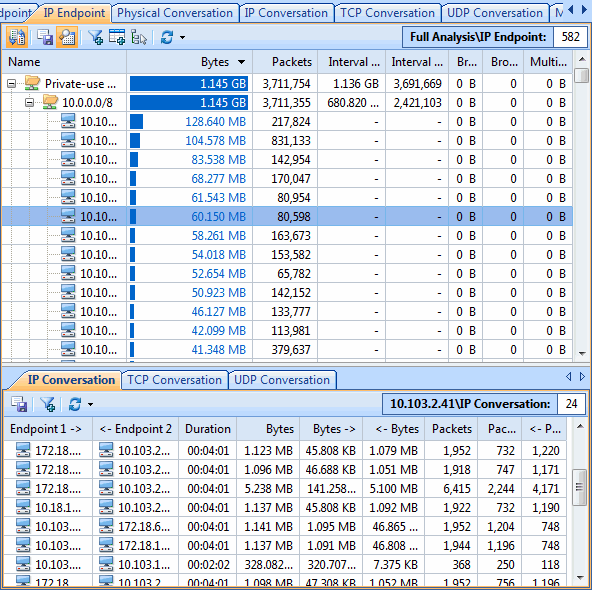
Figure 3: monitor network traffic by endpoints
Network traffic monitoring in the Protocol tab
The Protocol tab lists all protocols applied in your network transmission. In the Protocol tab we can monitor network traffic by each protocol. By analyzing the protocols in the network traffic, we can easily understand what applications are consuming the network bandwidth, for example, the HTTP stands for website browsing, and the POP3 stands for email, etc.
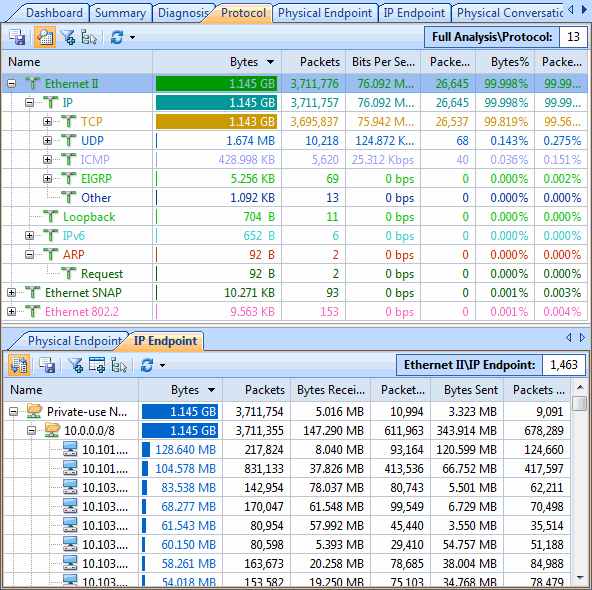
Figure 4: monitor network traffic in the Protocol tab
Network traffic monitoring in the conversation tabs
The conversations are shown in four tabs: Physical Conversation, IP Conversation, TCP Conversation and UDP Conversation. We can monitor network traffic by each conversation type and the figure out which conversation has generated the largest network traffic.
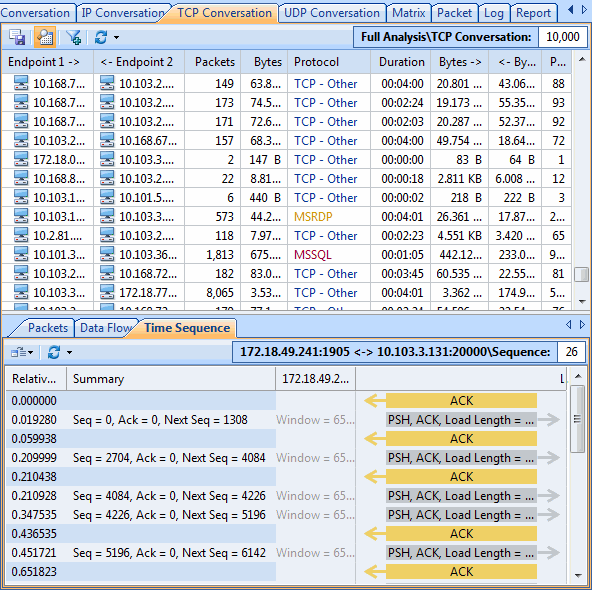
Figure 5: monitor network traffic by conversations
Network traffic monitoring in the Matrix tab
The Matrix tab visualizes all network connections and traffic details in one single graph. The weight of the lines between the nodes indicates the traffic volume and the color indicates the status. As we move the cursor on a specific node, network traffic details of the node will be provided.
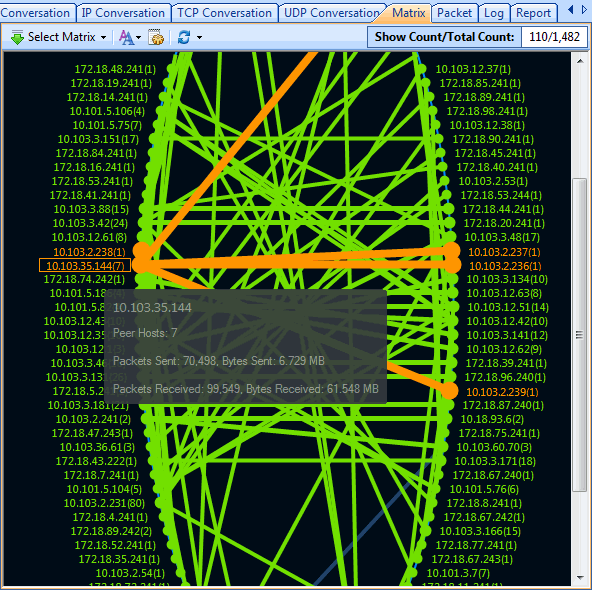
Figure 6: monitor network traffic in the Matrix tab
As we can see, with Capsa we can not only monitor network traffic in convenience, but also analyze network traffic in different levels, it enables us to quickly and efficiently detect network abnormities and troubleshoot network problems.