Define and Customize a Report
Colasoft nChronos provides twelve system reports, and users can define new reports according to need.
To define a report,
1. On the Report window, first click the node User-Defined Reports, and then click![]() to open the New Report dialog box:
to open the New Report dialog box:
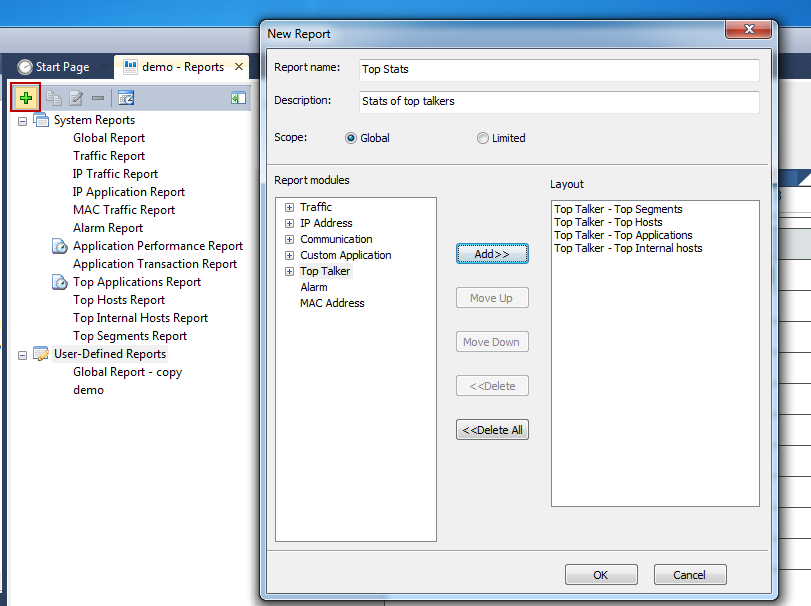
2. Enter the report name and the description.
3. Select the report scope.
- If you want to create a report for all network objects, click Global, which means the report statistics are calculated based on all network objects.
- If you want to create a report for a specific network object, click Limited to open the Report Scope dialog box:
The scope could be IP addresses, MAC addresses, network segment, or a user-defined application, which means the report statistics are calculated based on selected scope.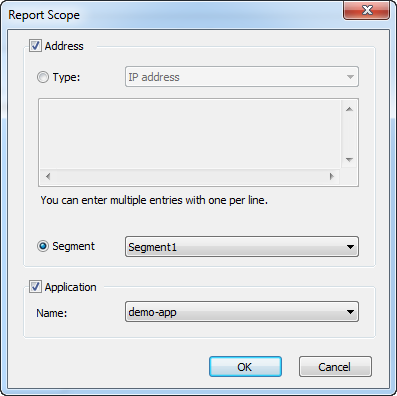
4. Click the report modules you are interested and then click Add to add the interested report modules to the new report. Different report scope is provided with different report modules. The Global scope is provided with all report modules. For some modules, you can set the number of statistical objects.
5. Click OK to save the definitions. You can view the new report under the node User-Defined Reports.
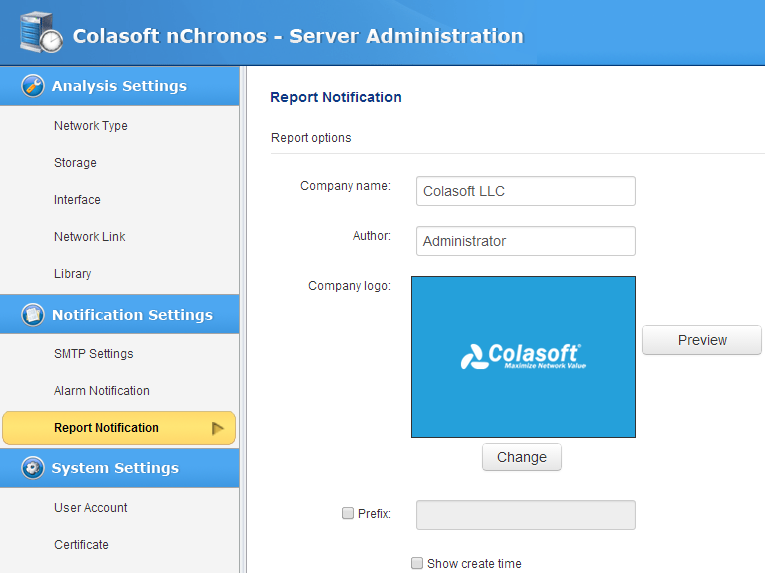
Besides defining new reports, you can customize the company name, company logo, author, report title prefix, whether to show create time, and all these settings can be done on the Report Notification page from Server web portal: