How to View and Analyze Historical Network Traffic
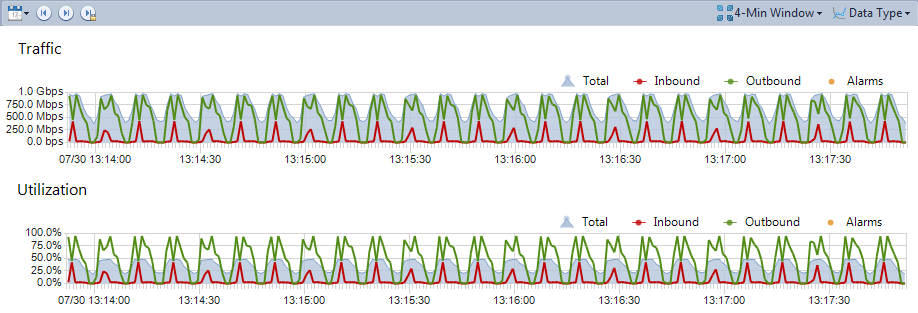
As a network performance analysis solution, nChronos allows users to view historical data just by a drag. Below is a screenshot of the Time Window, you can drag the trend charts back and forth to view the network traffic of any interested time period.
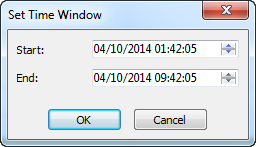
You can click the Set Time Window button ![]() to set which time period to show:
to set which time period to show:
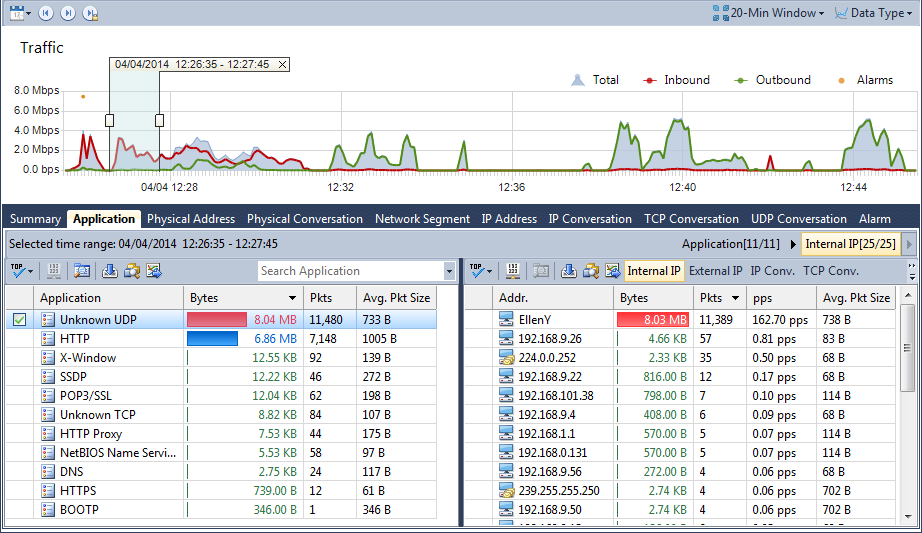
When you select a time slice on the Time Window, the analysis views will only show data related to that time slice, and this is very convenient to analyze a traffic spike. Just select the spike to view and analyze the top talkers in that spike. Furthermore, you can double-click a record item to drill down it: