How to Solve the Problem of Slow Access to Virtualized Services
With the rapid development of virtualization, more and more enterprises deploy application systems in virtualization environments, and traditional operation and maintenance platform can no longer to cope with the problems encountered in virtualization.
Problem Description
A telecom operator’s business management system was migrated to the Citrix Virtualization, but users reported that some business applications responded very slowly after the migration. The user's internal information system topology is as follows.
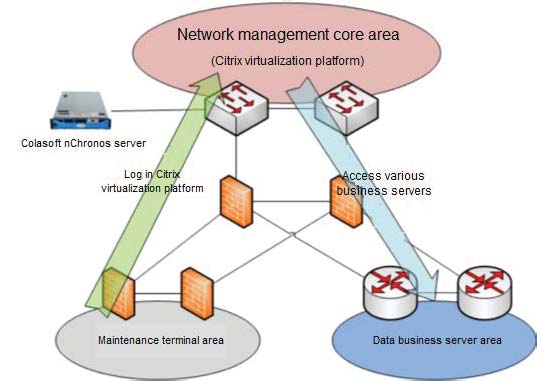
The Citrix server is located in the core business area. In the maintenance terminal area, IT personnel of each business system connect to the virtualization through the Citrix client, and then access the application system server in the data business area through the virtualization.
The three servers listed in the table below which make users feel the application responds slowly.
| -- | Core Server IP | Virtualization Platform IP | Application Architecture |
|---|---|---|---|
| Abnormal application management platform | X.X.8.18 | X.X.3.112 | C/S |
Analysis
A Colasoft nChronos server was deployed in the core switch of the core business area, mirroring the two-way traffic of the uplink port of the switch. nChronos system 7x24 captured traffic in the core business area, and the data is analyzed for the period of slow business and slow access. By capturing transaction process of Citrix with management terminal and business server, nChronos can help users to evaluate performance parameters such as network transmission delays and application system response delays in slow-access application transactions. With the analysis results, users can locate the root cause of slow business accessing.
Analyze Link Traffic
First, the engineer evaluate the link traffic by nChronos at the external of the core business area, the purpose of which is to see if there is congestion on the upstream link of the switch.
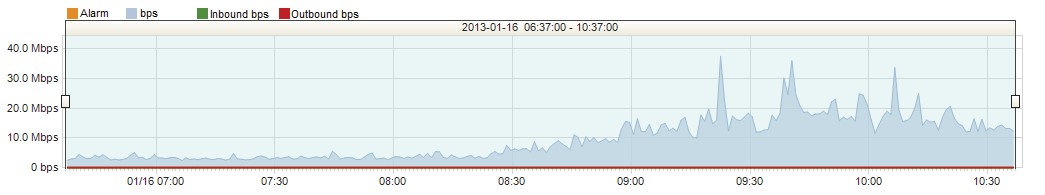
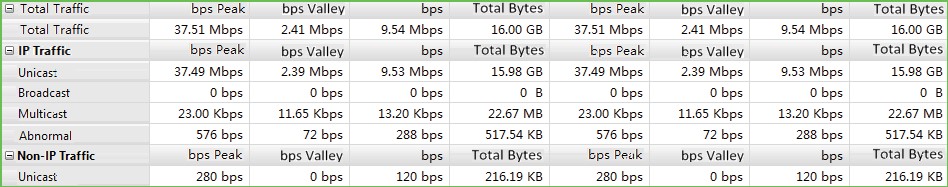
According to the figure above, it was shown that within 4 hours, the outbound peak traffic was 37.51 Mbps, which was far less than the total bandwidth. Therefore, the slow application access was not caused by excessive bandwidth utilization of outbound bandwidth.
Analysis of Application Management Platform
The application management platform takes about 1 minute from opening the client program to displaying the interface, and the user experience is very poor.
The figure below is the traffic trend analysis interface for Citrix X.X.X.112. It took about 50 seconds from open Citrix client to the initial interface displaying of application management platform. X.X.3.112 mainly communicated with X.X.3.125 (test terminal), X.X.3.86 (domain controller) and X.X.8.18 (business server). The other IPs were confirmed to be irrelevant to the test after analysis.
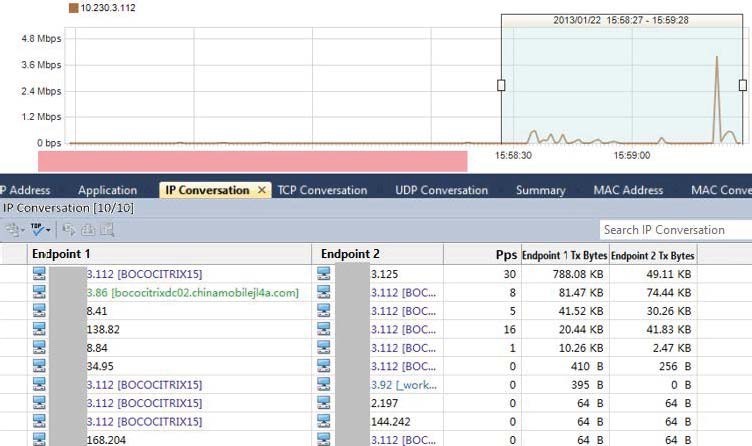
The traffic is less than 1MB, and the peak was about 4Mbps. There was almost no traffic from 15:58:45 to 15:59:22, which was abnormal. So, we needed to analyze the conversation during that period.
The engineer downloaded the packets from X.X.3.112, and then used TCP Conversation Reorganization of Expert Analyzer to analyze the TCP conversation flow.
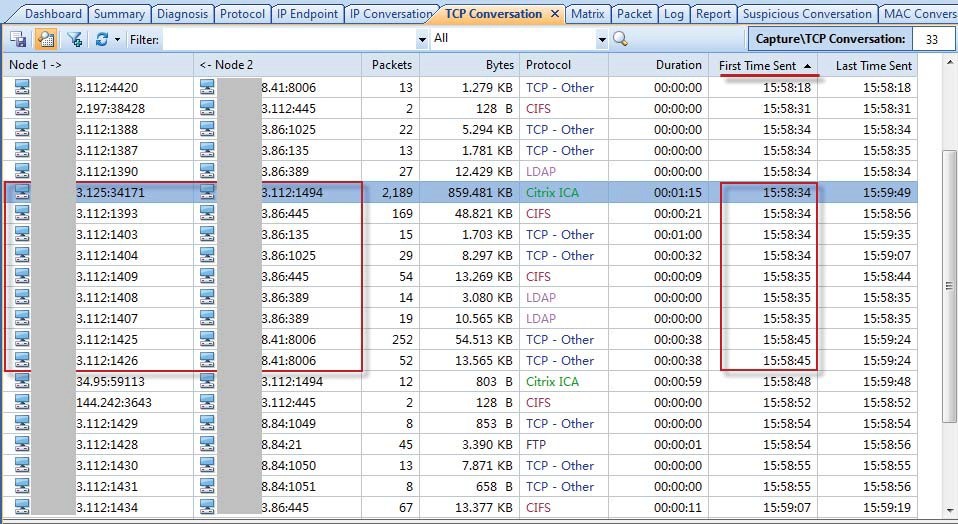
The items are sorted in First Time Sent. It can be seen that at 15:58:34, the test terminal X.X.3.125 sent a request to X.X.3.112 and a Citrix conversation was established, which last to the end. After the conversation was established, X.X.3.112 established several TCP conversations with the domain controller X.X.3.86. With its communication port and protocol type, the conversations related to domain authentication. At 15:58:45, X.X.3.112 sent requests to the abnormal application management server X.X.8.18 and established two TCP conversations with port 8006, which was the service port of the abnormal application management platform.
According to the conversation list, some of the conversations related to domain login which have a longer duration, so we first conduct a detailed analysis of each conversation triggered during login.
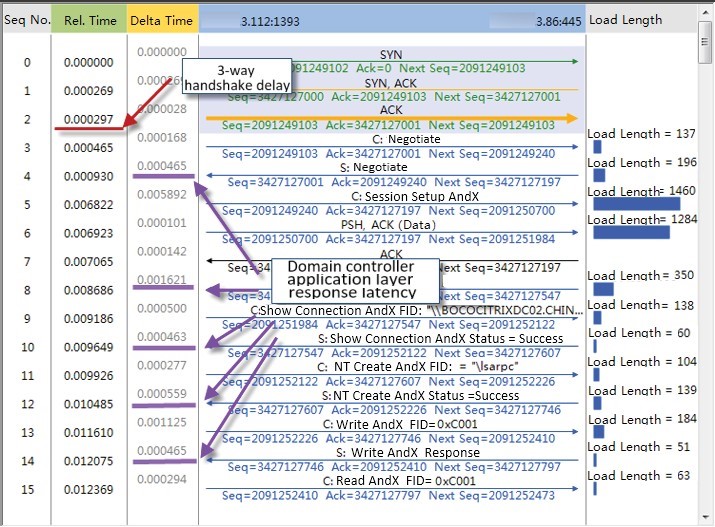
As we know, the three-way handshake delay can be considered as the client-to-server network response time (RTT). In the figure above, the three-way handshake delay between X.X.3.112 and X.X.3.86:445 was 2.97ms, so the network delay was very short. What’s more, the domain controller application layer response delay was about 1ms, which also was very short.
After the conversation started, the transaction will be completed in about 996ms, and then there will be about 20s of idle time. Show as below.
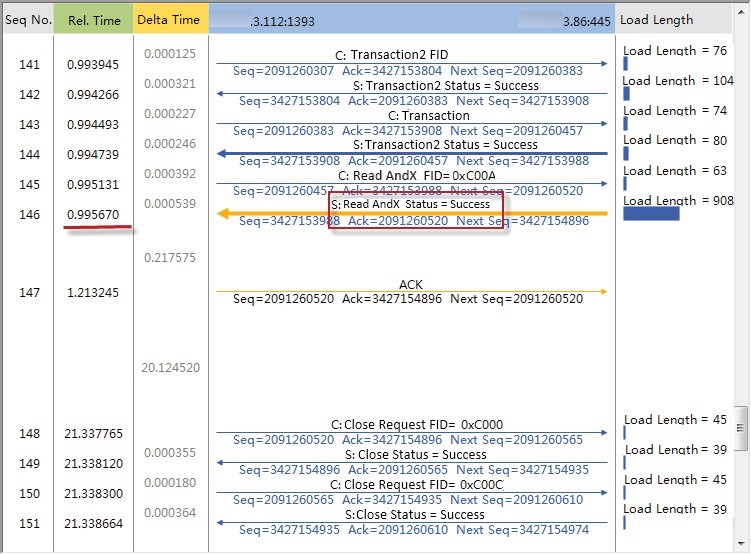
It can be judged that although the conversation lasted more than 20 seconds, the data interaction necessary for the login process was completed within 1 second.
By analyzing the other conversations triggered by domain logins, we found that all these conversations completed effective data interactions within 1 second. It can be determined that the domain authentication process started at 15:58:34, and it was completed at 15:58:36. Therefore, the authentication process of Citrix client login did not directly cause slow response.
Analyze Conversation Response Time
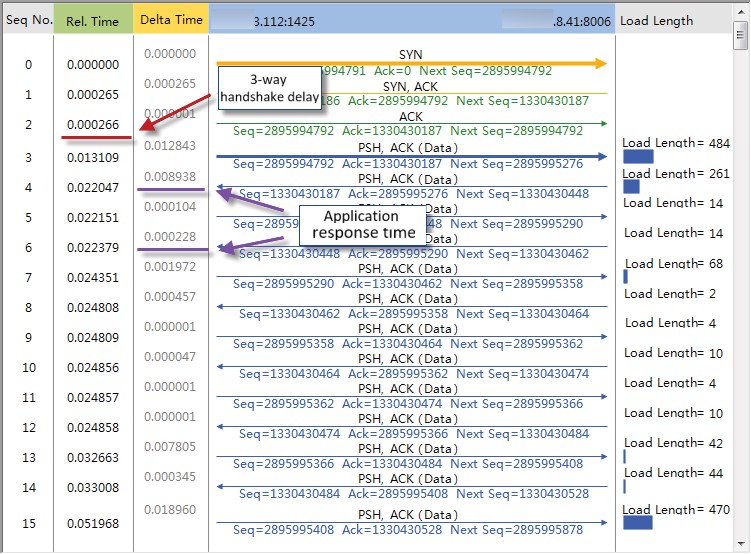
The figure below shows the two TCP conversations between the Citrix and application server X.X.8.18. The three-way handshake delay and response time of application layer are also very short.
However, according to the overall delay statistics of the conversation, we can see that the main time occupancy comes from the client idle time. Show as below.
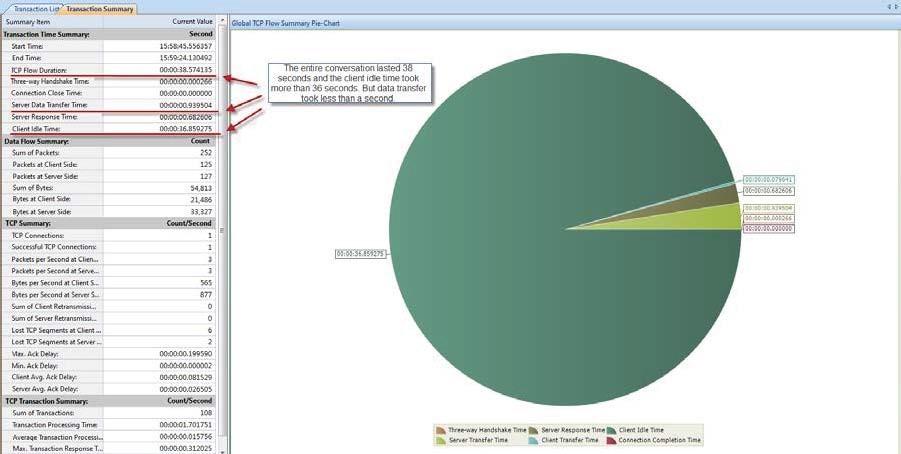
Client idle time is the interval between the completion of an application layer interaction and the next application layer request. There is no additional operation that requires manual intervention during the process of opening the application platform client. Therefore, a large number of client idle time indicates that the client system X.X.3.112 or the client has problem, which resulting in the failure to send the next application layer request to the server in time.
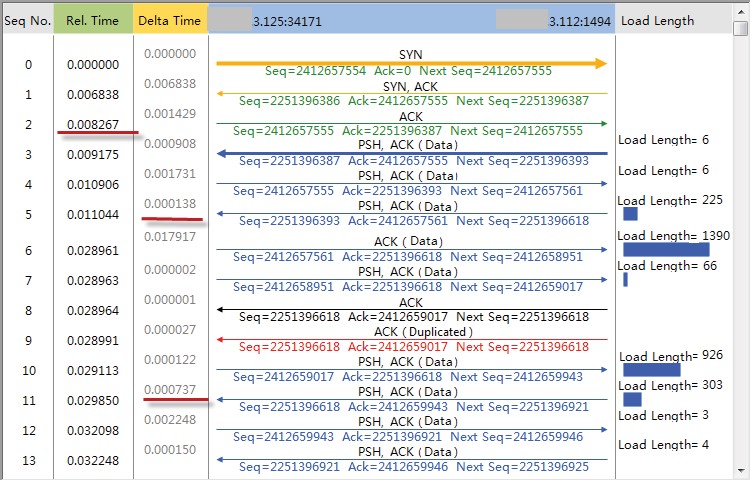
It can be seen that there was an obvious client idle for both conversations in the transaction sequence diagram. Show as below.
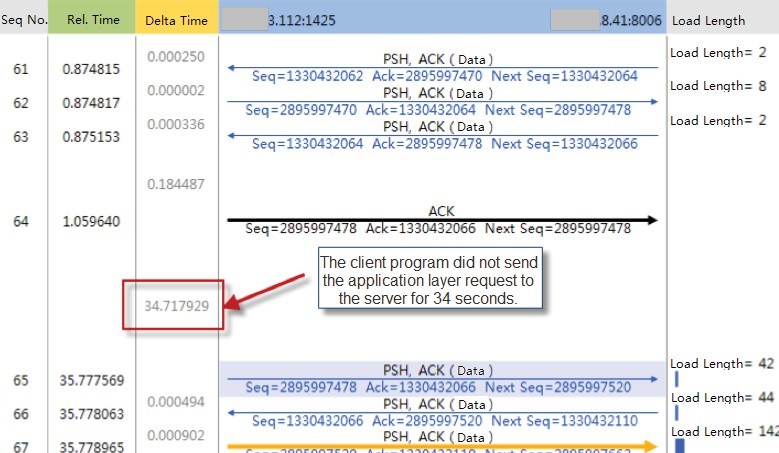
It was inferred that the client idle caused slow response. It was likely that the client processing is too slow, and no application layer request to be sent for a long time.
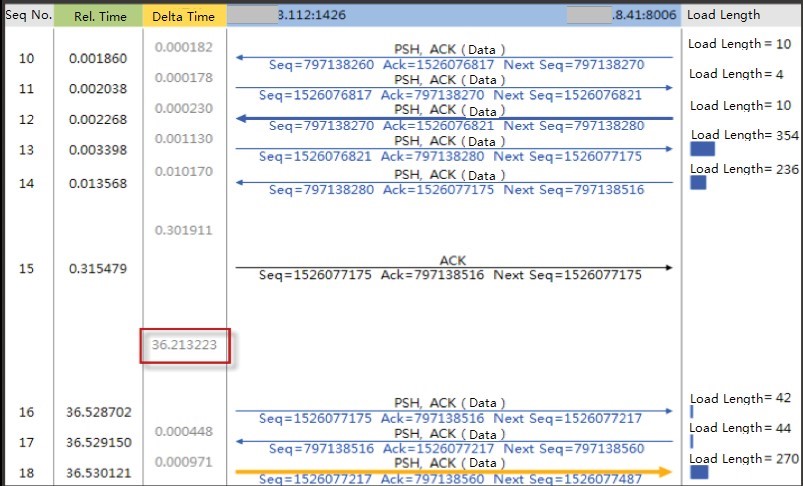
Then we randomly selected some TCP conversations between X.X.3.112 and X.X.8.18, and found the same client idle. Show as below.
And after the client idle, X.X.3.112 mainly initiated the following two application layer requests,
select right_id, right_type, module_id, module_name, right_name, right_value from tco_role_rights where role_id =… and right_type=…
select userid, config_class_name, config_version, config from tap_wf_userRelatedConfigs where userid=… and config_class_name=… and config_version=…
Therefore, it was inferred that the client program processed too slowly before sending those two requests. And the system developers were advised to get in-depth analysis of program processing.
Analyze Citrix Response Time
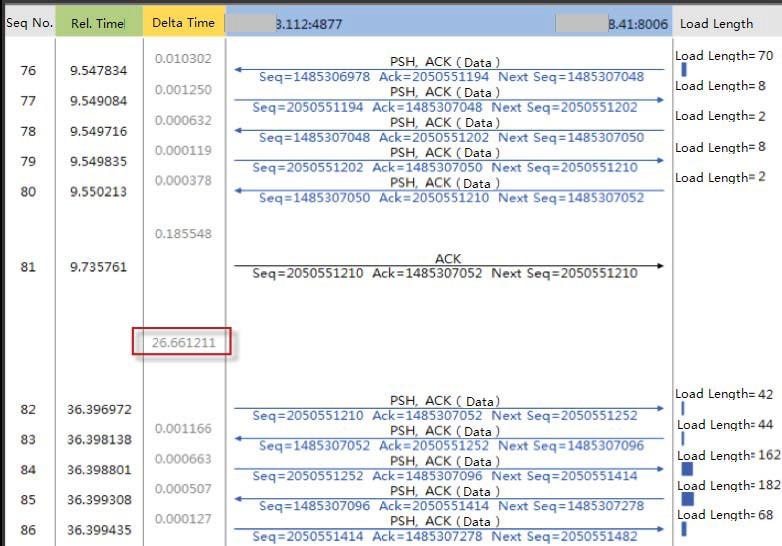
The figure below shows the conversation between the user terminal and the Citrix X.X.3.112. It can be seen that the three-way handshake and application layer response time are very fast.
During the client idle time, there was only a small amount of data interaction between X.X.3.112 and X.X.3.125. At 15: 58: 21.336, X.X.3.112 sent a lot of large data packets to X.X.3.125. Show as below.
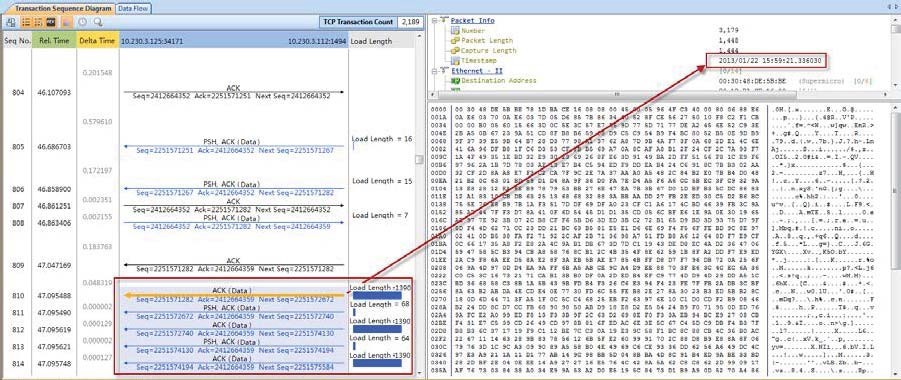
What’s more, this time coincided with the time when X.X.3.112 sent a new application layer request to X.X.8.18 after a long wait (lag 3ms), which showed that Citrix can quickly send image data to user terminals after the application processed.
It can be judged that the Citrix had not caused obvious delay in user access.
Analysis Conclusion
The slow application response has nothing to do with network infrastructure, Citrix and Server X.X.8.41. The main reason for the slow response was the slow processing of the application management client on X.X.3.112.
There are two possibilities,
Value
When an application access failure occurs after the application is migrated to virtualization, and due to the good running state of virtual host and the network, the compatibility of the virtualization will be considered in most cases, so it is difficult to locate the failure in a short time.
With Colasoft nChronos, we can comprehensively monitor network traffic, and use traffic analysis technology to compare and analyze multi-segments traffic, quickly locate the fault and improve the efficiency of fault recovery.