UPM Features
Visualized Business Running Status
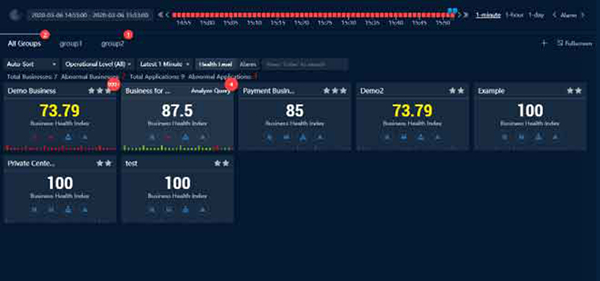
Colasoft UPM enhances network management mode from physical network oriented to business network oriented, enables users to make proactive network analysis strategy based on business system. It shows the visual overall running status of the business, enabling operators to keep track of the running quality of each business. The business status page is provided to display business running performance, business status, the number of related alarms, etc.
Comprehensive Application Metric
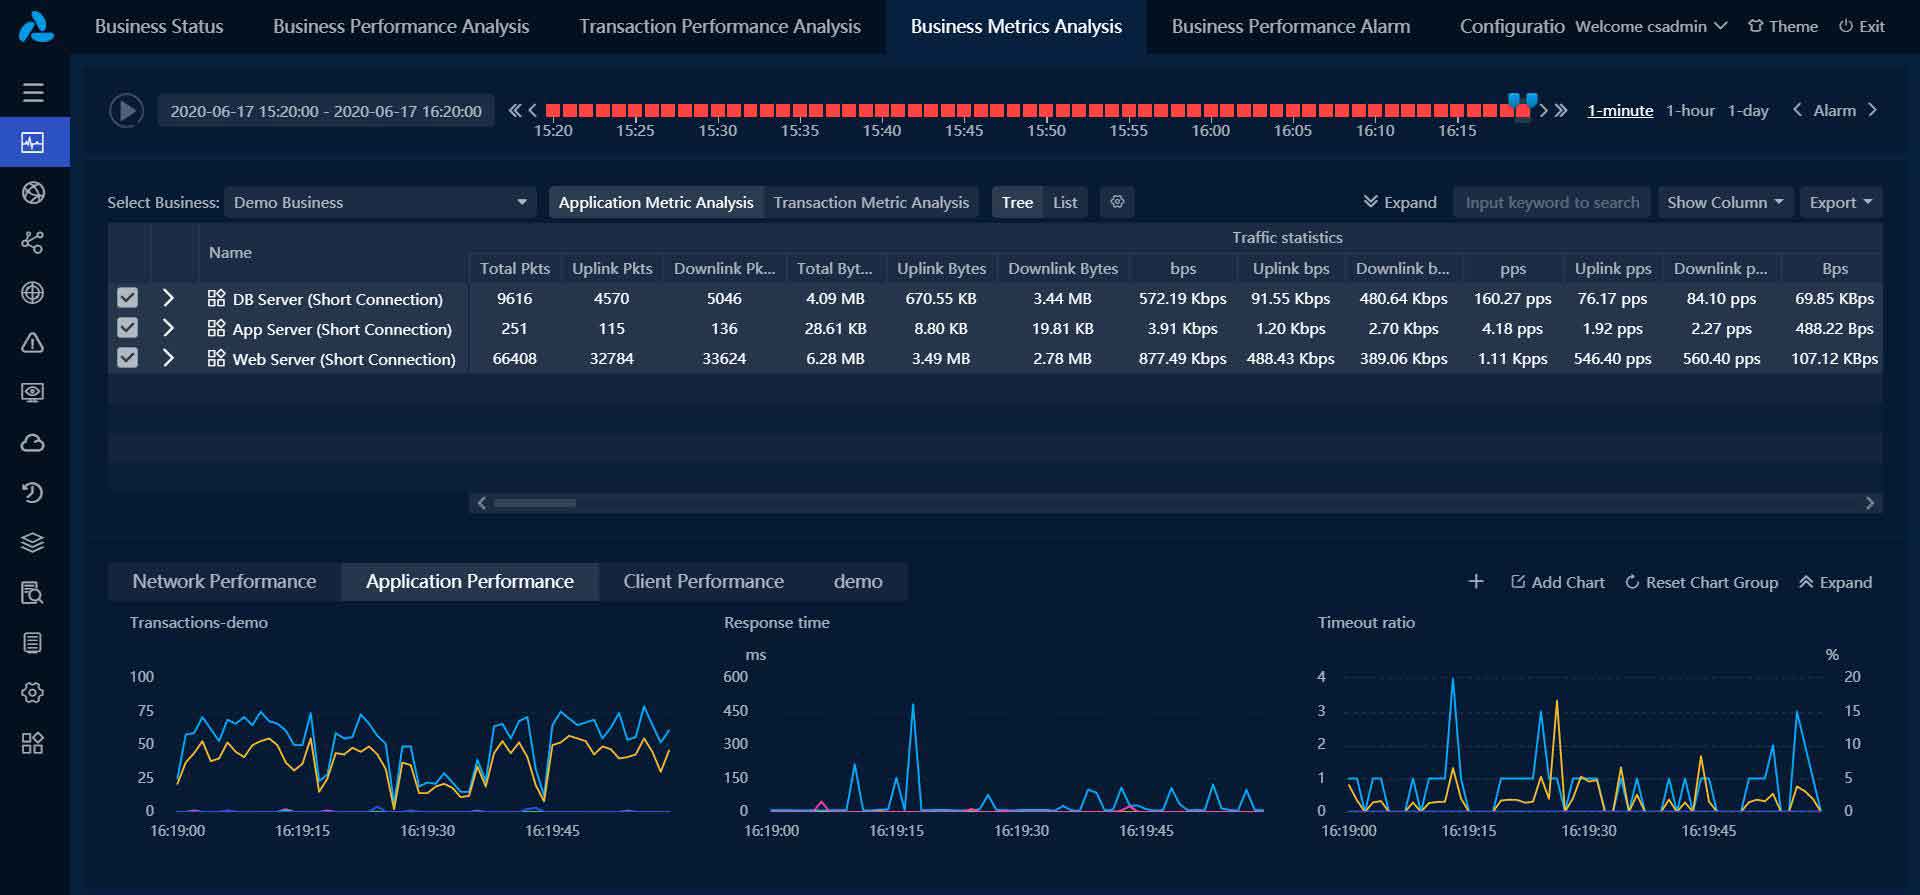
Colasoft UPM provides around 100+ metrics related to business and application. It also supports comparison analysis of the metric at the same period in history, displaying in abundant graphs. Users can learn and analyze the running status and fault reason of the application service in an all-round way through comprehensive metric query.
Multi-segment Correlation Troubleshooting
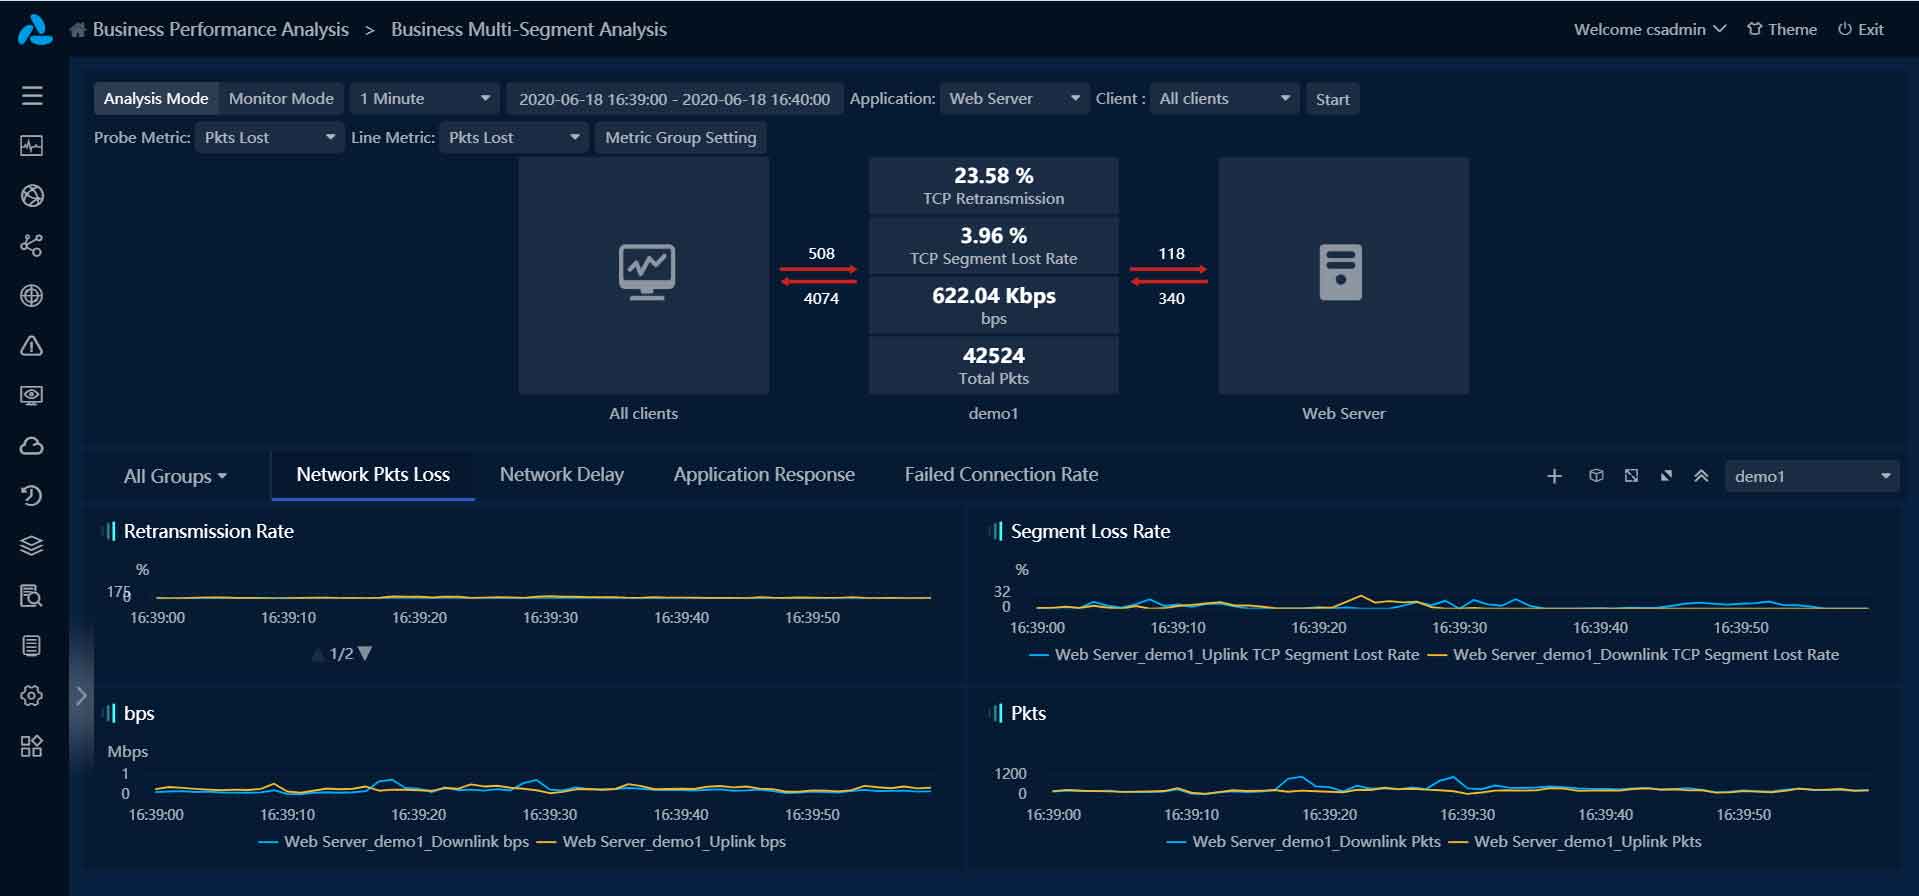
Colasoft UPM supports correlated analysis on data from one application but collected at different points, so as to find the problems of segment loss, retransmission and time delay of applications to help users locate the network nodes that lead to low service quality.
Real-time Alarms
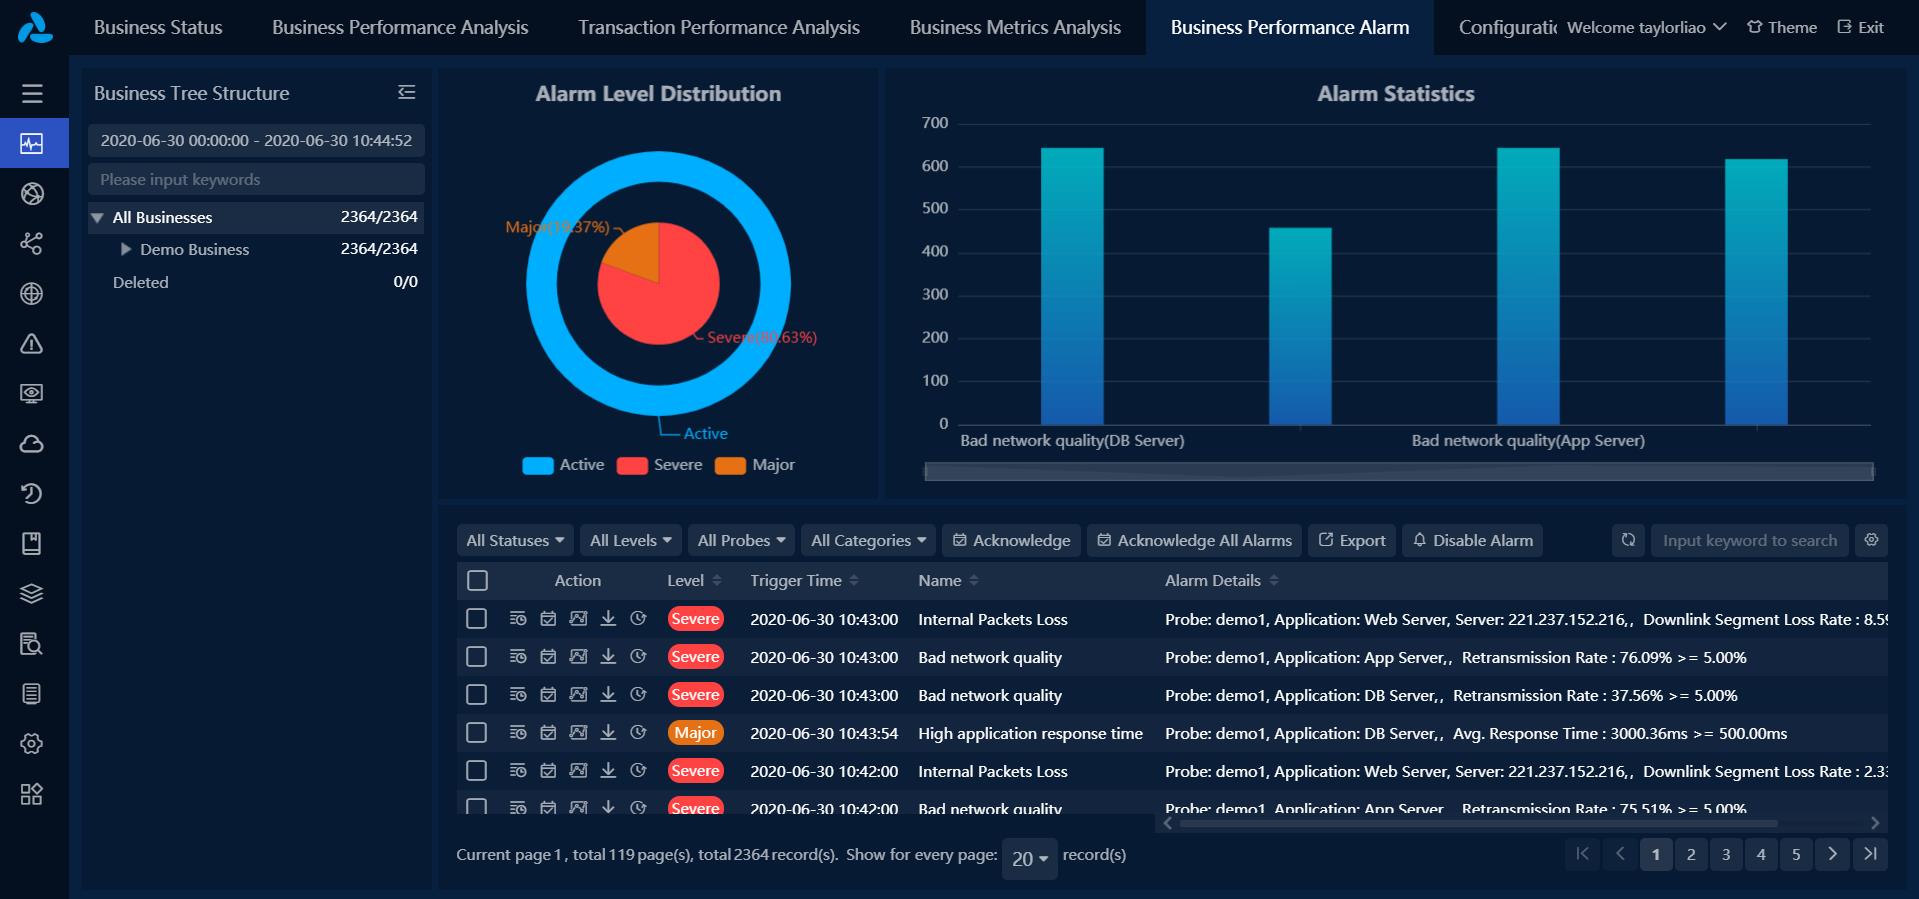
Colasoft UPM provides several alarm types: business alarm, application alarm, probe traffic alarm. All the alarms can be defined by users, and UPM system provides lots of alarm trigger conditions, which is convenient for operational staff to customize alerts based on their business and network environment. Besides, UPM provides intelligent alarms and performance alarms, which will be triggered based on UPM built-in alarm conditions. Alarm statistical charts and lists are available to display all alarm logs.
Reports Based on Probes, Businesses or Applications
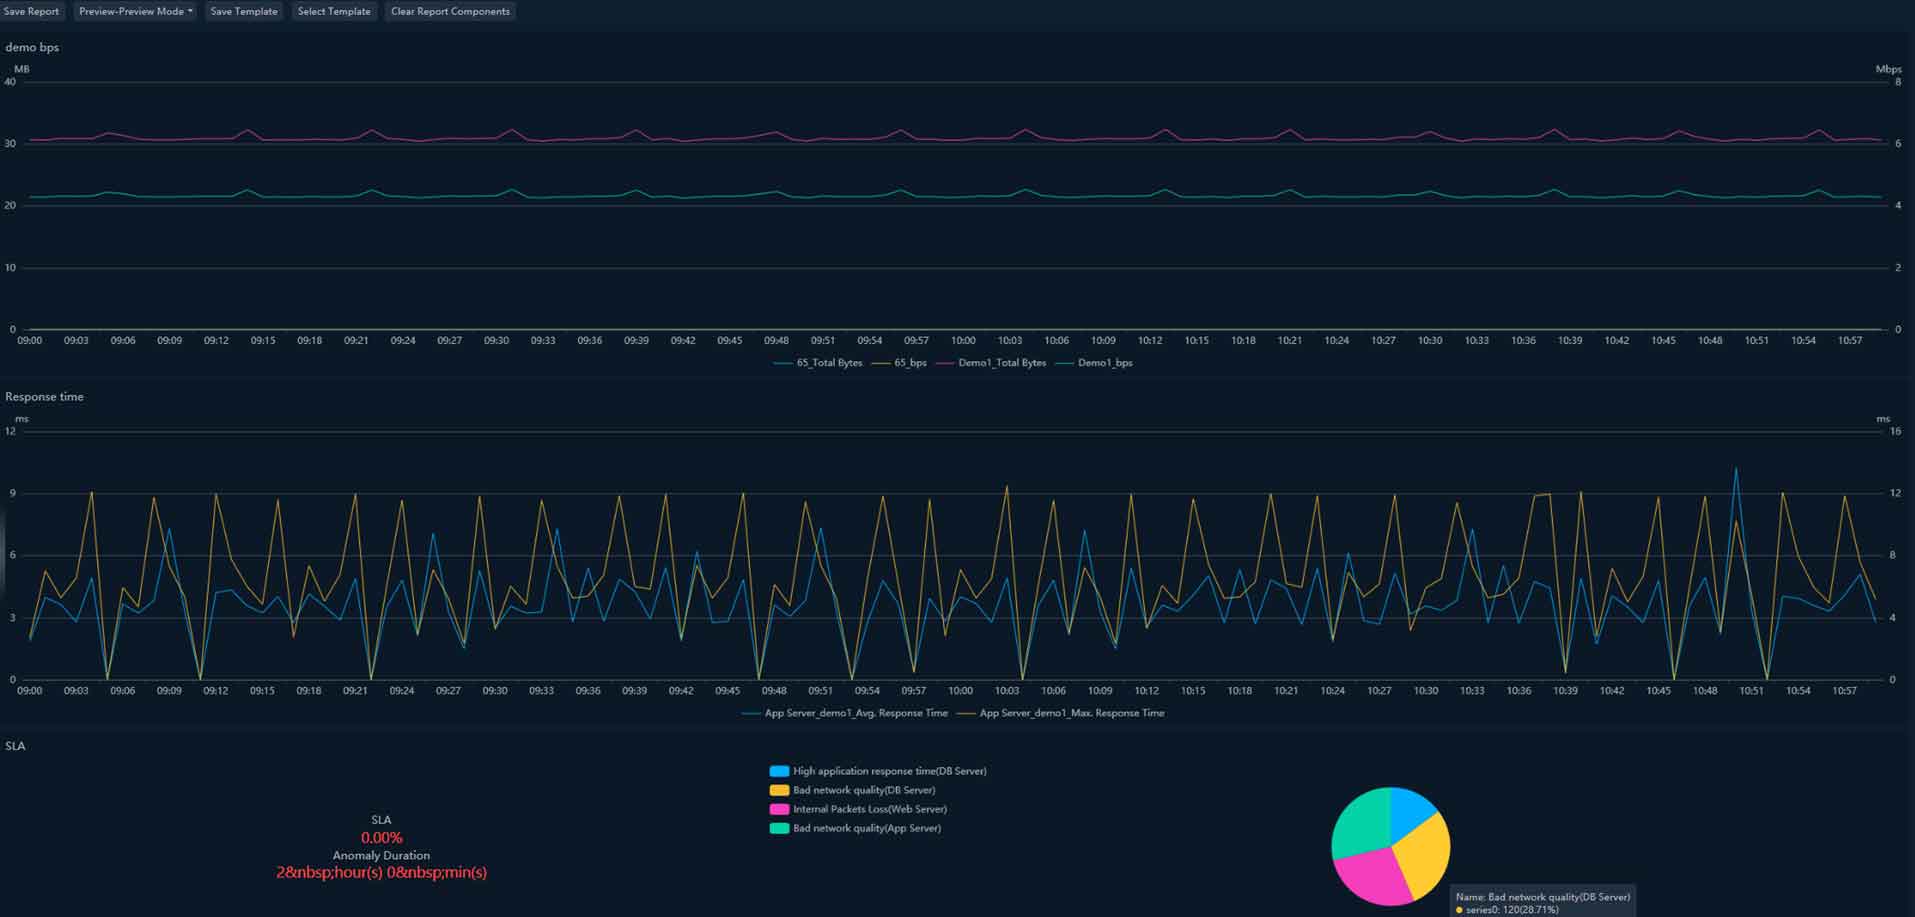
Businesses, applications or probes running status and monitoring results can be generated as SLA reports, in which summarizing and calculating the statistical data helps decision-maker to master the historical running status of key businesses and applications.
Quick Analysis of Business Performance Problem
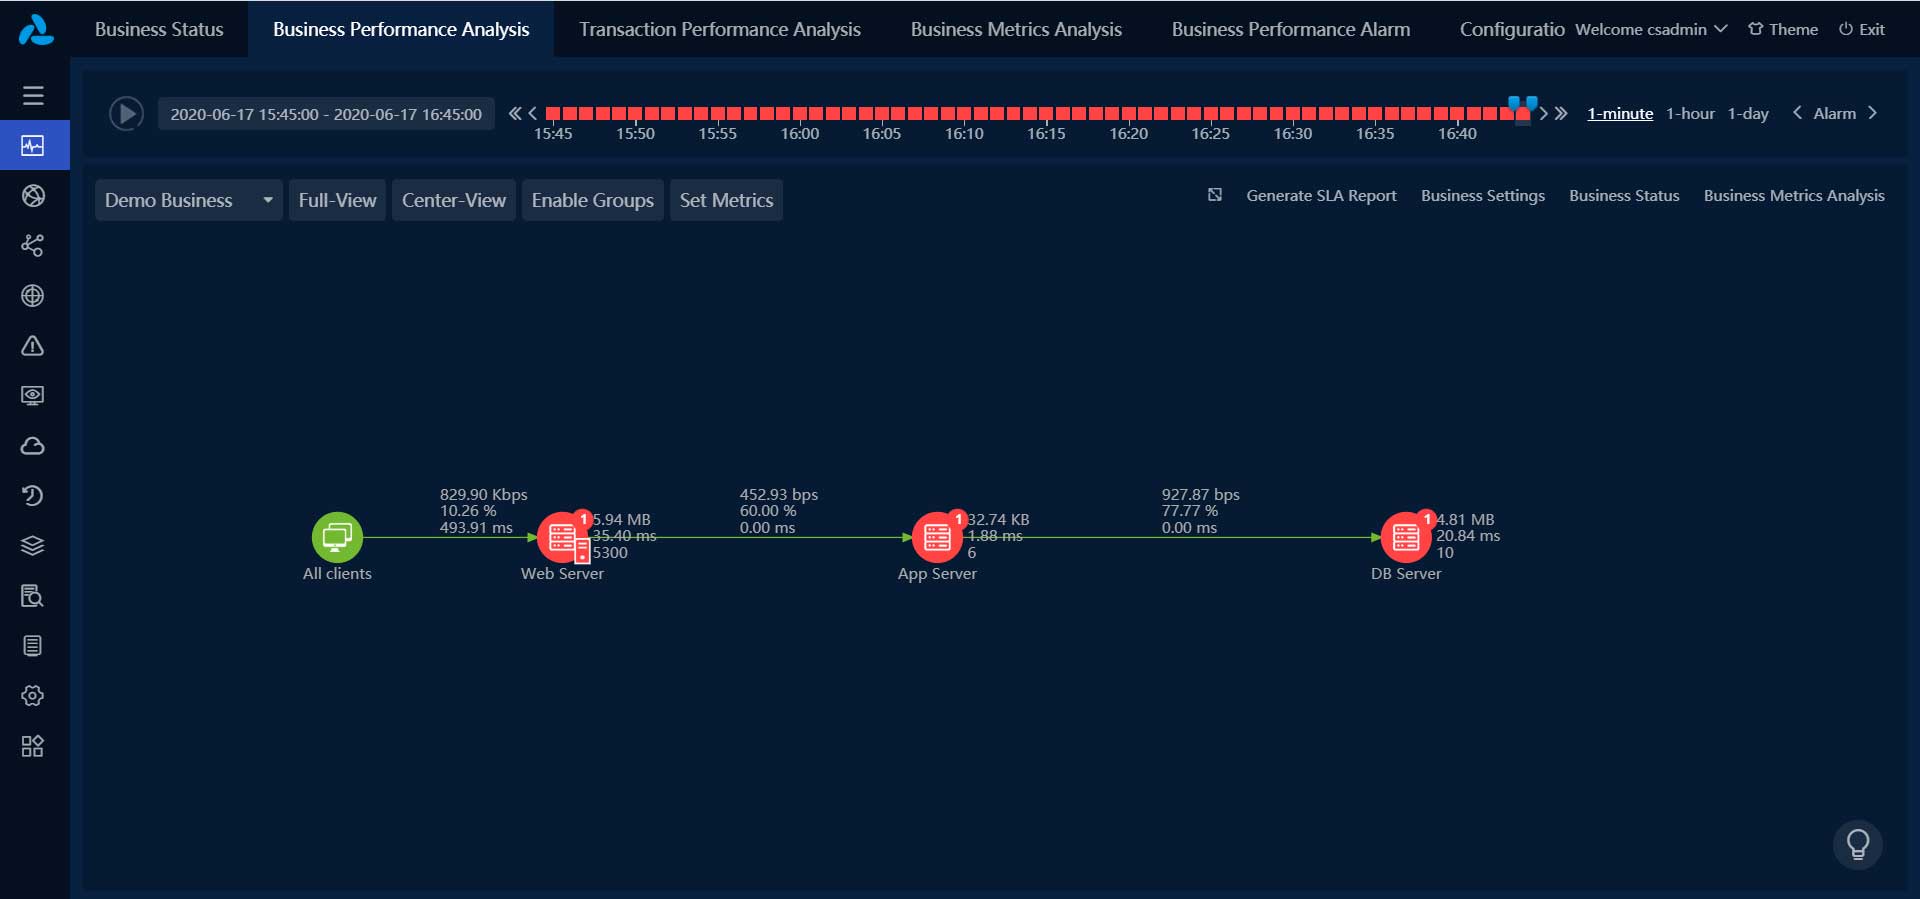
Colasoft UPM displays the running status of all the applications which form a business with business logic diagrams. Users can review the application services, hosts and network paths supporting business system through this graph. Graphically displaying the key performance metrics and working status of the business helps users quickly locate the link that causes business system anomalies.
Packets Retrieval and Download
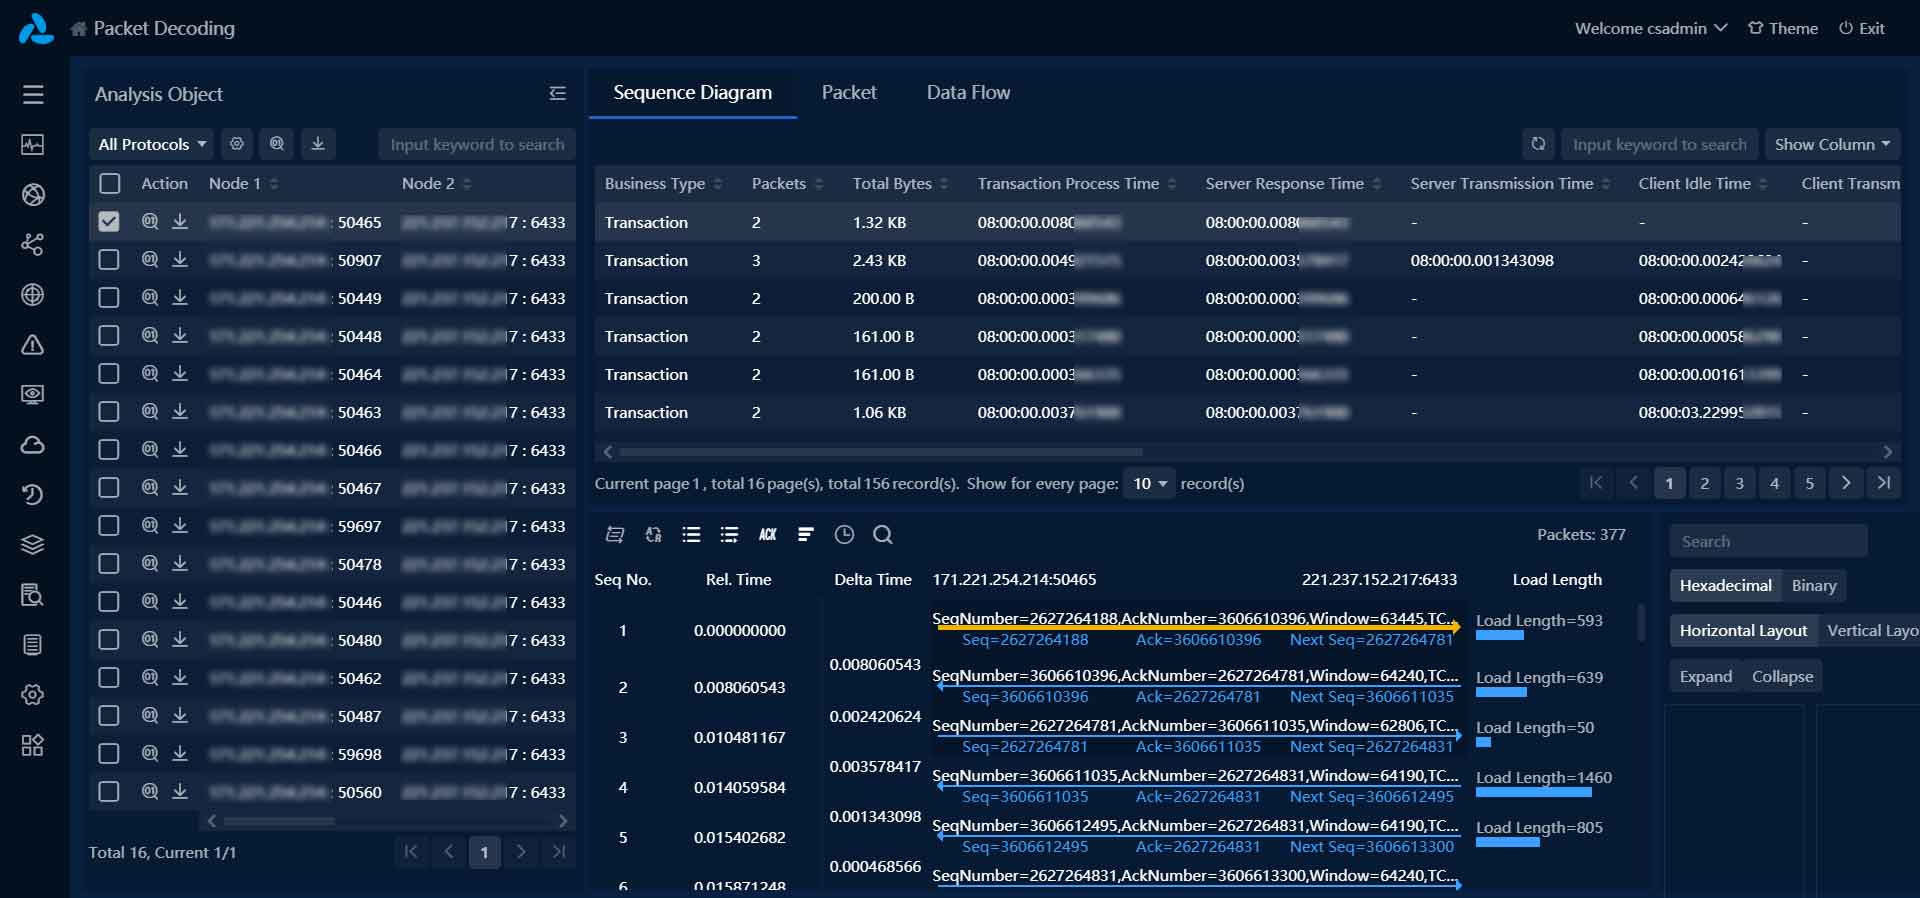
Colasoft UPM supports downloading original packets. Users can retrieve and download packets of any time period stored at the frontend devices related to the business, so as to provide direct data evidence for solving complex business failures. UPM also provides an online decoding feature, which allows users to get decoding view in the browser.
Network Monitoring and Analysis
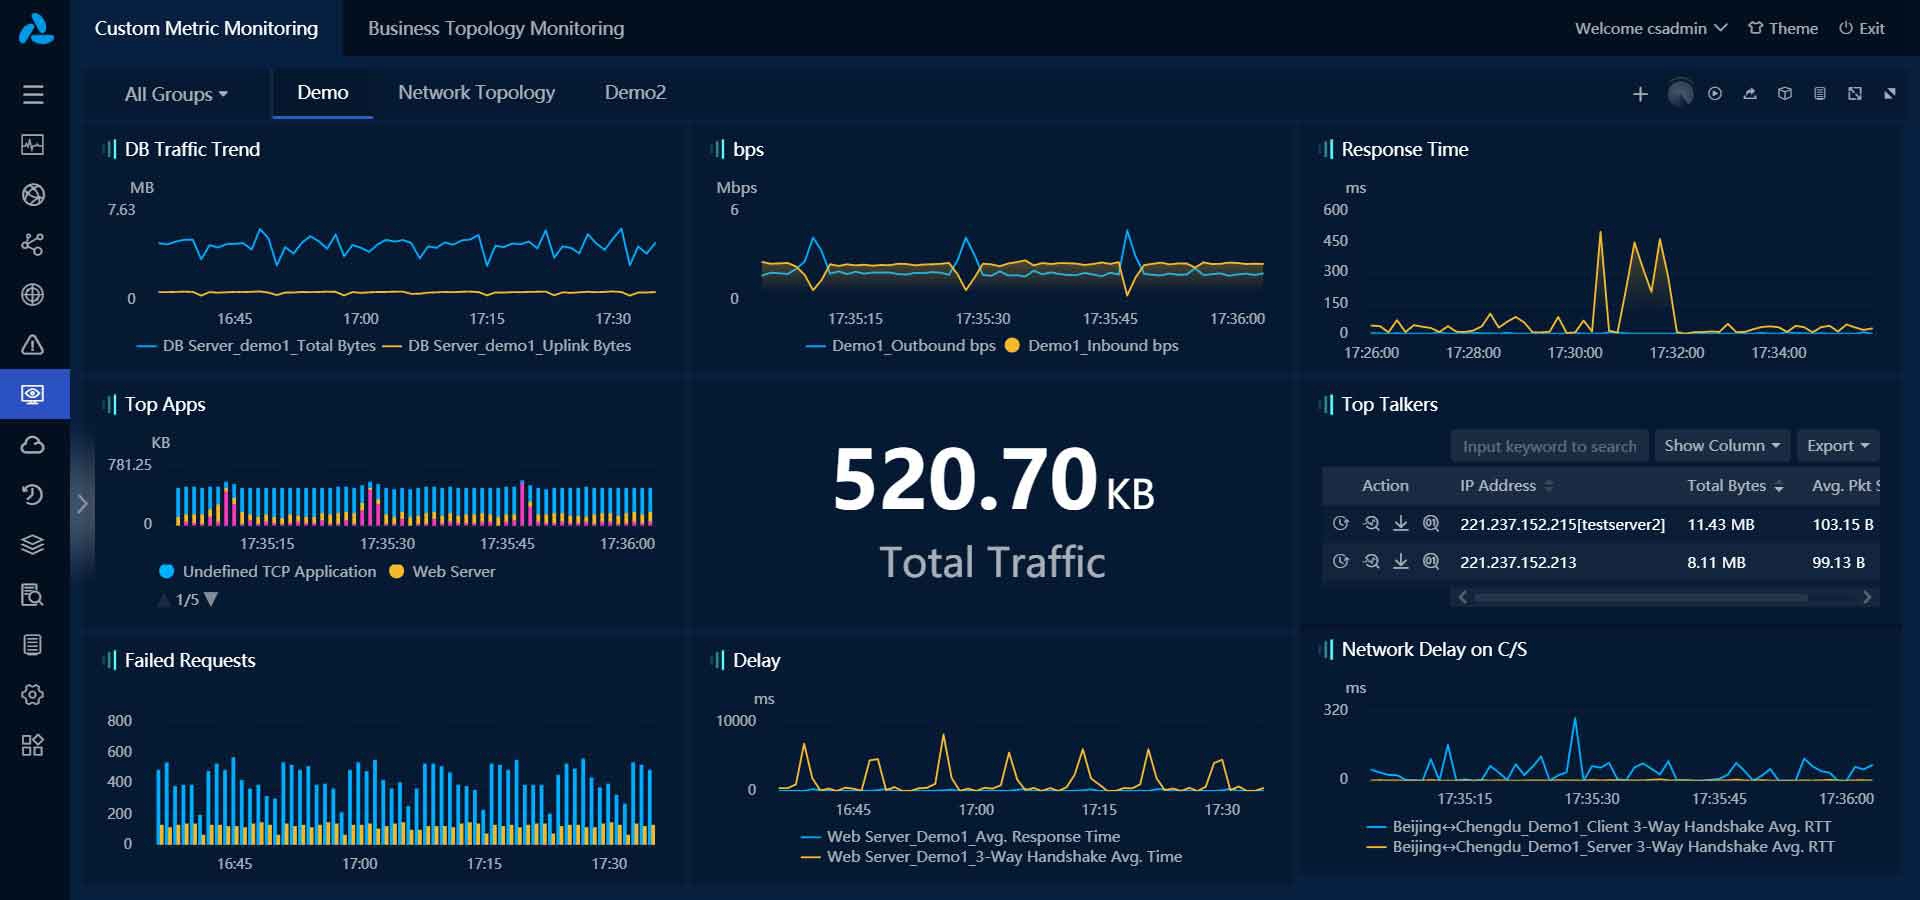
Colasoft UPM supports network monitoring and analysis. Users can monitor network performance by customizing multiple charts, such as alarm log chart, metric table chart, etc. Users can also analyze network segment corresponding metrics to clearly know the network status.
Intelligently Application Relationships Discovery
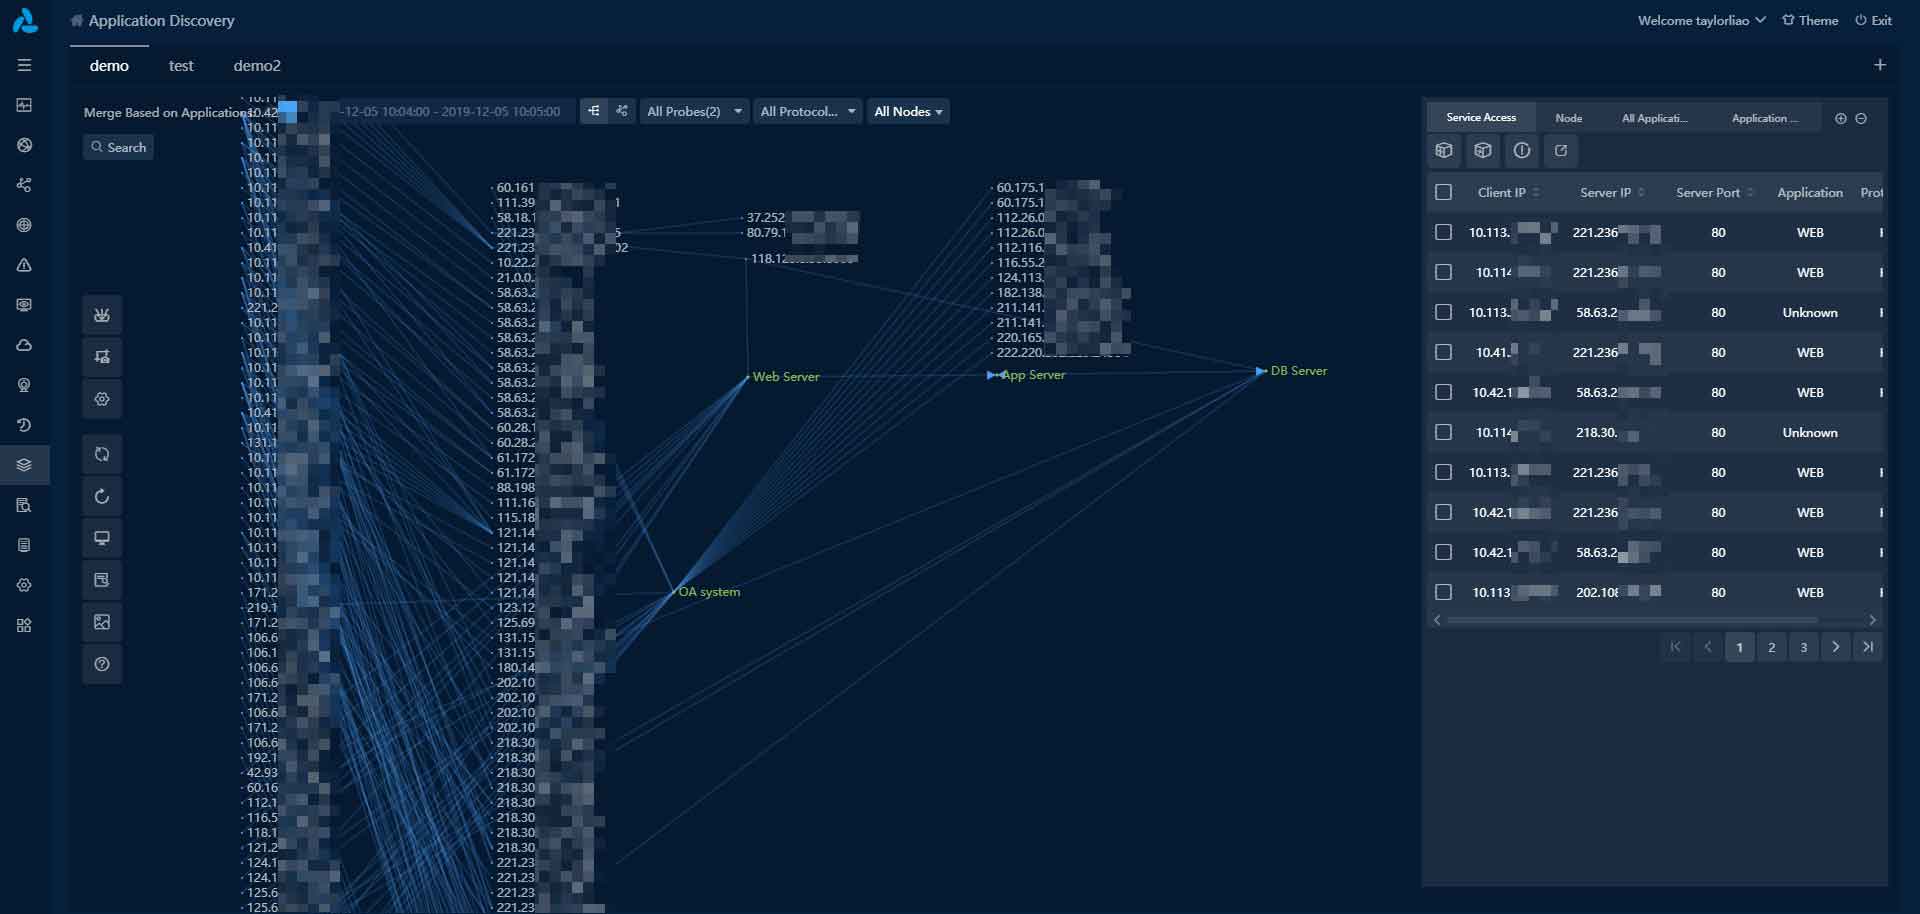
Once the network traffic is captured and analyzed, UPM Center can draw a network communication diagram based on the traffic. UPM Center is also able to draw a diagram to show the application access relationships among the nodes.