Capsa Review

Author: Chris Partsenidis
July 3, 2010Colasoft Capsa v7.2.1 Network Analyser
Introduction
A Network Analyser is without doubt an Engineer's best friend.
Using network analysing software, we are able to monitor our network and dig into the various protocols to see what's happening in real time. This can help us understand much better the theoretical knowledge we've obtained throughout the years but, most importantly, help us identify, troubleshoot and fix network issues that we wouldn't be able to do otherwise.
A quick search on the Internet will surely reveal many network analysers available making it very confusing to select one. Some network analysers provide basic functions, such as packet sniffing, making them ideal for simple tasks while others give you all the necessary tools and functions to ensure your job is done the best possible way.
Colasoft's network analyser is a product that falls in the second category. We had the chance to test drive the Colasoft Network Analyser v7.2.1 which is the latest available version at the time of writing.
Having used previous versions of Colasoft's network analyser, this latest version we tested left us impressed and does, in fact, promise a lot no matter what the environment demands.
The Software
Colasoft's Capsa network analyser is available as a demo version directly from their website www.colasoft.com. We quickly downloaded the 21.8mb file and began the installation which was a breeze. Being small and compact meant the whole process didn't take more than 30-40 seconds.
We fired up the software, entered our registration details, activated our software and up came the first screen which shows a completely different philosophy to what we have been used to:
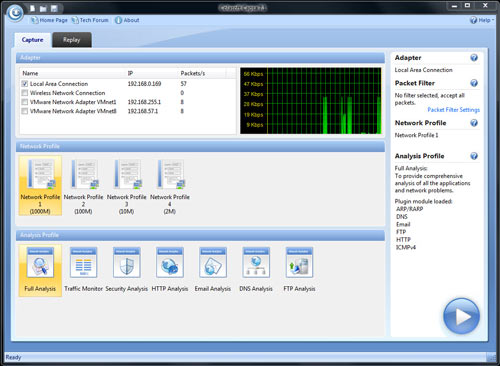
Before you even start capturing packets and analysing your network, you're greeted with a first screen that allows you to select the network adaptor to be used for the session, while allowing you to choose from a number of preset profiles regarding your network bandwidth (1000, 100, 10 or 2 Mbps).
Next, you can select the type of analysis you need to run for this session ranging from Full analysis, Traffic Monitoring, Security analysis to HTTP, Email, DNS and FTP analysis. The concept of pre-configuring your packet capturing session is revolutionary and very impressive. Once the analysis profile is selected, the appropriate plug-in modules are automatically loaded to provide all necessary information.
For our review, we selected the ‘100Mb Network’ profile and ‘Full Analysis’ profile, providing access to all plug-in modules, which include ARP/RARP, DNS, Email, FTP, HTTP and ICMPv4 – more than enough to get any job done!
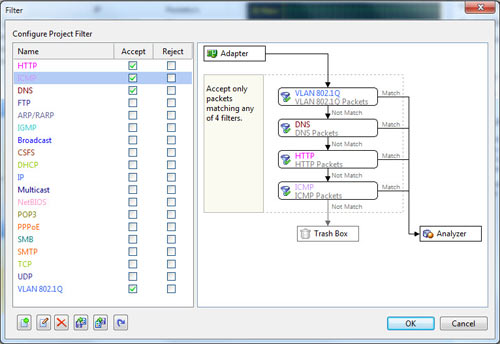
Optionally, you can use the ‘Packet Filter Settings’ section to apply filters to the packets that will be captured:
The Main Dashboard
As soon as the program loaded its main interface, we were left surprised with the wealth of information and options provided.
The interface is broken into four sections: tool bar, node explorer, dashboard and online resource. The node explorer (left lower side) and online resource (right lower side) section can be removed, providing the dashboard with the maximum possible space to view all information related to our session.
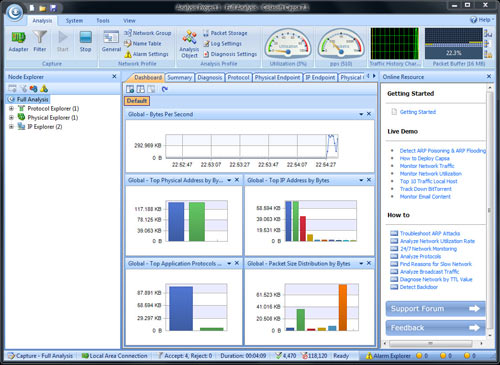
The menu provided allows the configuration of the program, plus access to four additional tools: Ping, Packet Player, Packet Builder and MAC Scanner.
To uncover the full capabilities of the Colasoft Capsa Network Analyser, we decided to proceed with the review by breaking down each of the four sections.
The ToolBar
The toolbar is populated with a number of options and tools that proved extremely useful and are easily accessible. As shown below, it too is broken into smaller sections allowing you to control the start - stop function of your capturing session, filters, network profile settings from where you can set your bandwidth settings, profile name, alarms and much more.
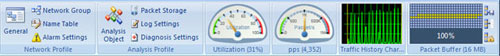
The Analysis section is populated with some great features we haven't found in other similar tools. Here, you can enable or disable the built-in ‘diagnosis settings’ for over 35 different protocols and tcp/udp states.
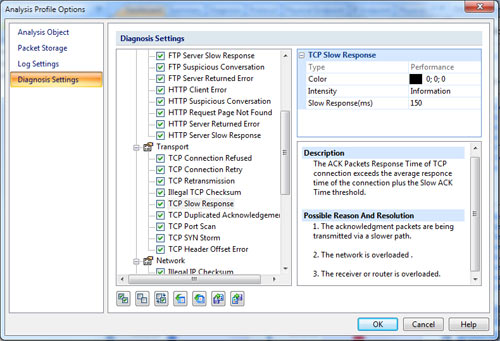
When selecting a diagnosis setting, Colasoft Capsa will automatically explain, in the right window, what the setting shows and the impact on the network. When done, click on the OK button and you're back to the main capturing screen.
The Analysis section also allows you to change the buffer size in case you want to capture packets for an extended period of time and, even better, you can enable the ‘auto packet saving’ feature which will automatically save all captured packets to your hard drive, making them available whenever you need them.
Right next to the analysis section is the 'Network Utilisation' and 'pps' (packets per second) gauges, followed by the 'Traffic History Chart'. These nifty gauges will show you in almost realtime the utilisation of your network card according to the network profile you selected before, plus any filters that might have been selected.
For example, if a 100Mbps network profile was selected, the gauges will represent the utilisation of a 100Mbps network card. If, in addition, filters were selected e.g. HTTP, then both gauges will represent a 100Mbps network utilisation only for the HTTP protocol. So if there were a large email or FTP download, it wouldn't register at the gauges as they will only show utilisation for HTTP traffic, according to the filter.
To give the gauges a try, we disabled all filters and started a 1.4Gig file transfer between our test bed and server, over our 100Mbps network. Utilisation hit the red areas while the pps remained at around 13,000 packets per second.
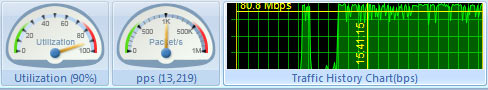
The gauges are almost realtime as they are updated once every second, though we would have loved to see them swinging left-right in real time. One issue we encountered was that the 'Traffic History Chart' seemed to chop off the bandwidth value when moving our cursor toward the top of the graph. This is evident in our screenshot where the value shown is 80.8Mbps, and makes it almost impossible to use the history chart when your bandwidth is almost 100% utilised. We hope to see this fixed in the next version.
At the very end of the toolbar, the 'Packet Buffer' provides visual feedback on how full the buffer actually is, plus there are a few options to control the packet buffer for that session.
Node Explorer & DashBoard
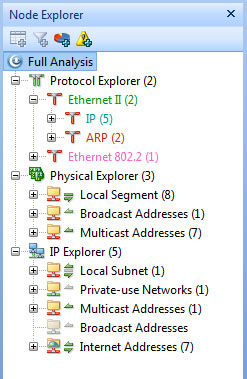
On the lower left area we'll find the 'Node Explorer' which works in conjunction with the main dashboard to provide the information of our captured session. The Node Explorer is actually a very smart concept as it allows you to instantly filter information captured.
The Node Explorer starts populating the segmented areas automatically as it captures packets on the network. It provides a nice break-down of the information using a hierarchical approach that also follows the OSI model.
As we noticed, we could choose to select the Physical Explorer that contained nodes with MAC Addresses, or select the IP Explorer to view information about nodes based on their IP Address.
Each of these sections are then further broken down as shown. A nice simple and effective way to categorise the information and help the user find what is needed without searching through all captured packets.
Once we made a selection (Protocol Explorer/Ethernet II/IP (5) as shown below, the dashboard next to it provided up to 13 tabs of information which are analysed in the next screenshot.
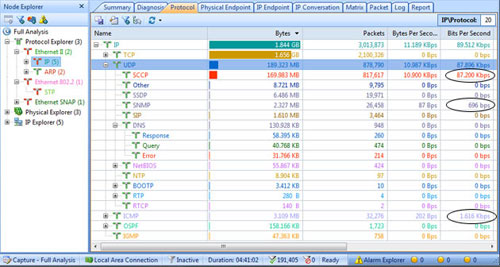
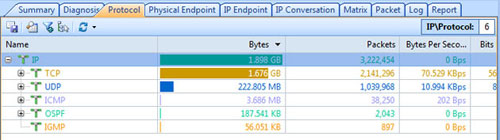
Selecting the IP Tab, the protocol tab in the main dashboard provided a wealth of information and we were quickly able to view the quantity of packets, type of traffic, amount of traffic and other critical information for the duration of our session.
We identified our Cisco Call Manager Express music-on-hold streaming under the UDP/SCCP, which consumes almost 88Kbps of bandwidth, an SNMP session which monitors a remote router accounting for 696bps of traffic, and lastly the ICMP tracking of our website, costing us another 1.616Kbps of traffic. All together, 89.512Kpbs.
This information is automatically updated every second and you can customise the refresh rate from 10 presets. One function we really loved was the fact we could double-click on any of the shown protocols and another window would pop up with all packets captured for the selected protocol.
We double-clicked on the OSPF protocol (second last line in the above screenshot) to view all packets related to that protocol and here is what we got:
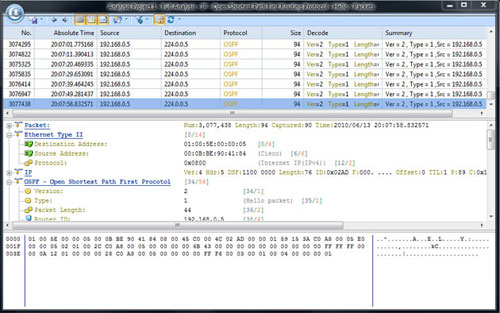
Clearly there is no need to use filters as we would probably need to in other similar type of software, thanks to the smart design of the Node Explorer and Dashboard. Keep in mind that if we need to have all packets saved, we will need the appropriate buffer, otherwise the buffer is recycled as expected.
Going back to the main area, any user will realise that the dashboard area is where Colasoft's Capsa truly excels and unleashes its potential. The area is smartly broken into a tabbed interface and each tab does its own magic:

The user can quickly switch between any tabs and obtain the information needed without disrupting the flow of packets captured.
Let's take a quick look at what each tab offers:
Summary Tab
The Summary tab is an overview of what the network analyser 'sees' on the network.
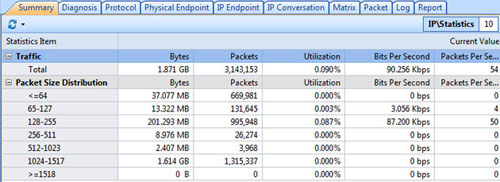
We get brief statistics on the total amount of traffic we've seen, regardless of whether it’s been captured or not, the current network utilisation, bits per second and packets per second, plus a breakdown of the packet sizes we've seen so far. Handy information if you want to optimise your network according to your network packet size distribution.
Diagnosis Tab
The Diagnosis tab is truly a goldmine. Here you'll see all the information that related to problems automatically detected by Colasoft Capsa without additional effort!
This amazing section is broken up into the Application layer, Transport layer and Network layer (not shown). Capsa will break down each layer in a readable manner and show all related issues it has detected.
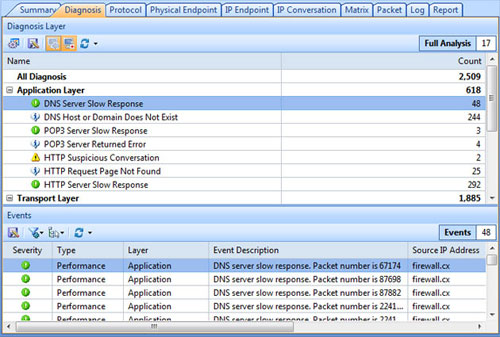
Once a selection has been made - in our example we choose the 'Application layer/ DNS Server Slow Response' - the lower area of the window brings up a summary of all related packets this issue was detected in.
Any engineer who spends hours trying to troubleshoot network issues will truly understand the power and usefulness of this feature.
Protocol Tab
The Protocol tab provides an overview and break-down of the IP protocols on the network, along with other useful information as shown previously in conjunction with the Node Explorer.
Physical Endpoint Tab
The Physical Endpoint tab shows conversations from physical nodes (Mac Addresses). Each node expands and its IP Address is revealed to help track the traffic. Similar statistics regarding the traffic is also shown:
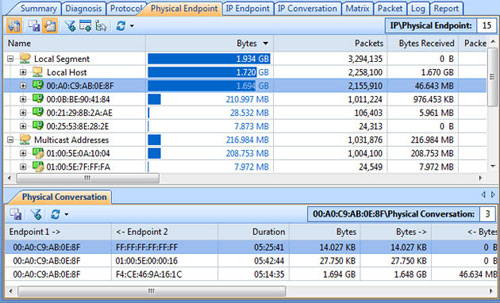
As with previous tabs, when selecting a node the physical conversation window opens right below and shows the relevant conversations along with their duration and total traffic.
IP Endpoint Tab
The IP Endpoint tab offers similar information but on the IP Layer. It shows all local and Internet IP addresses captured along with statistics such as number of packets, total bytes received, packets per second and more.
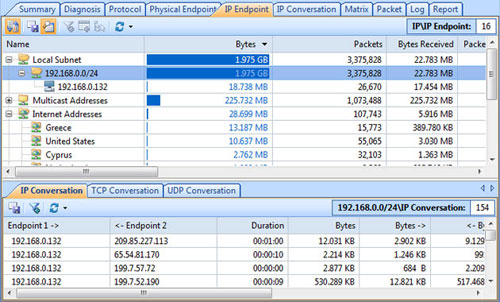
When selecting an IP Address, Capsa will show all IP, TCP and UDP conversations captured for this host.
IP Conversation Tab
The IP Conversation tab will be useful to many engineers. It allows the tracking of conversations between endpoints on your network, assuming all traffic passes through the workstation where the Capsa Network Analyser is installed.
The tab will show individual sessions between endpoints, duration, bytes in and out from each end plus a lot more.
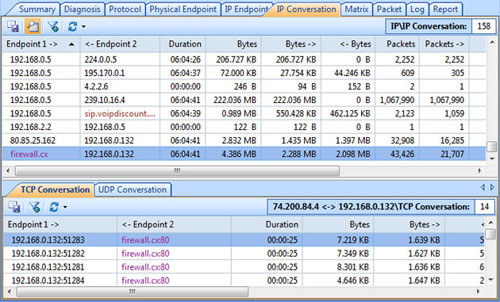
Network engineers can use this area to troubleshoot problematic sessions between workstations, servers and connections toward the Internet. Clicking on a specific conversation will show all TCP and UDP conversations between the hosts, allowing further analysis.
Matrix Tab
The Matrix tab is an excellent function probably only found on Colasoft's Capsa. The matrix shows a graphical representation of all conversations captured throughout the session. It allows the monitoring of endpoint conversations and will automatically resolve endpoints when possible.
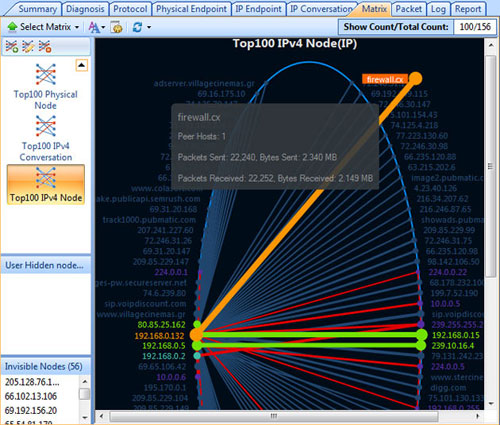
Placing the mouse over a string causes Capsa to automatically show all relevant information about conversations between the two hosts. Active conversations are highlighted in green, multicast sessions in red and selected session in orange.
The menu on the left allows more options so an engineer can customise the information.
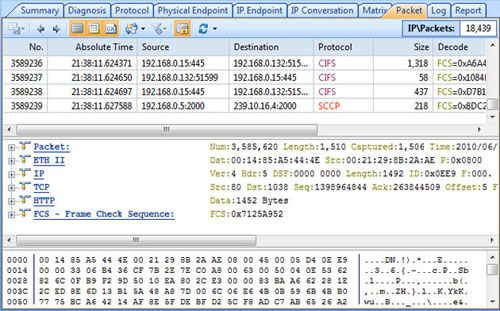
Packet Tab
The Packet tab gives access to the packets captured on the network. The user is able to lock the automatic scrolling or release it so new packets are shown as they are captured or have the program continue capturing packets without scrolling the packet window. This allows ease of access to any older packet without the need to scroll back for every new packet captured.
Even though the refresh time is customisable, the fastest refresh rate was only every 1 second. We would prefer a 'realtime' refresh rate and hope to see this implemented in the next update.
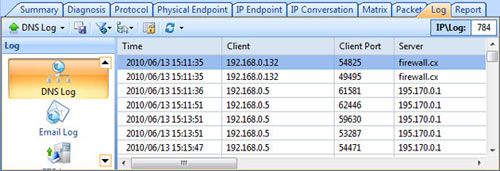
Log Tab
The Log tab offers information on sessions related to specific protocols such as DNS, Email, FTP and HTTP. It's a good option to have, but we found little value in it since all other features of the program fully cover the information provided by the Log tab.
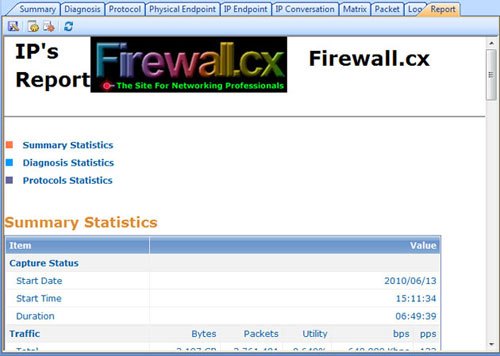
Report Tab
The report tab is yet another useful feature of Colasoft's Capsa. It will allow the generation of a network report with all the captured packets and can be customised to a good extent. The program allows the engineer to insert a company logo and name, plus customise a few more fields.
The options provided in the report are quite a few, the most important being the Diagnosis and Protocol statistics.
Finally, the report can be exported to PDF or HTML format to distribute it accordingly.
Professionals can use this report to provide evidence of their findings to their customers, making the job look more professional and saving hours of work.
Online Resource
The 'Online Resource' section is a great resource to help the engineer get the most out of the program. It contains links and live demos that show how to detect ARP poisoning attacks, ARP Flooding, how to monitor network traffic efficiently, track down BitTorrents and much more.
Once the user becomes familiar with the software they can select to close this section, giving its space to the rest of the program.
Final Conclusion
Colasoft's Capsa Network Analyser is without doubt a goldmine. It offers numerous enhancements that make it pleasant to work with and easy for anyone to find the information they need. Its unique functions such as the Diagnosis, Matrix and Reports surely make it stand out and can be invaluable for anyone troubleshooting network errors.
While the program is outstanding, it can do with some minor enhancements such as the real-time presentation of packets, more thorough network reports and improvement of the traffic history chart. Future updates will also need to include a 10Gbit option amongst the available network profies.
We would definitely advise any network administrator or engineer to give it a try and see for themselves how great a tool like Capsa can be.
About the Reviewers
Chris Partsenidis is a CCNA certified Engineer, MCP, LCP, Founder & Senior Editor of Firewall.cx
Manolis Partsenidis is a CCNA, CCNA Voice Engineer, MCP and Systems Engineer of Firewall.cx