powerful tcp flow analysis
TCP (Transmission Control Protocol), designed as a reliable and connection-oriented protocol, uses acknowledgement to ensure every single bit is delivered to the receiver. Network administrators can use some of features in network analysis, especially for network slow response troubleshooting. By analyzing TCP transaction pattern, they can learn the following:
- How the client and server use TCP to exchange data?
- Which one causes the slow response, the server, client or the network itself?
- Is there any packet loss or retransmission?
- What’s the meaning of each request?
For network analysis and network troubleshooting, TCP packets reveal useful information to help us troubleshoot slow network, especially for the cases like slow website response, slow CRM transactions and slow downloading or uploading, etc. The first step of all to resolve a slow network issue is to figure out which one causes the slowdown, the client, the server or the network itself? The TCP Flow Analysis window of Capsa provides details on how many requests and responses between the client and server, what’s the time delay in each transaction and how much data they carry. All of them are shown on a diagram clearly (figure below).
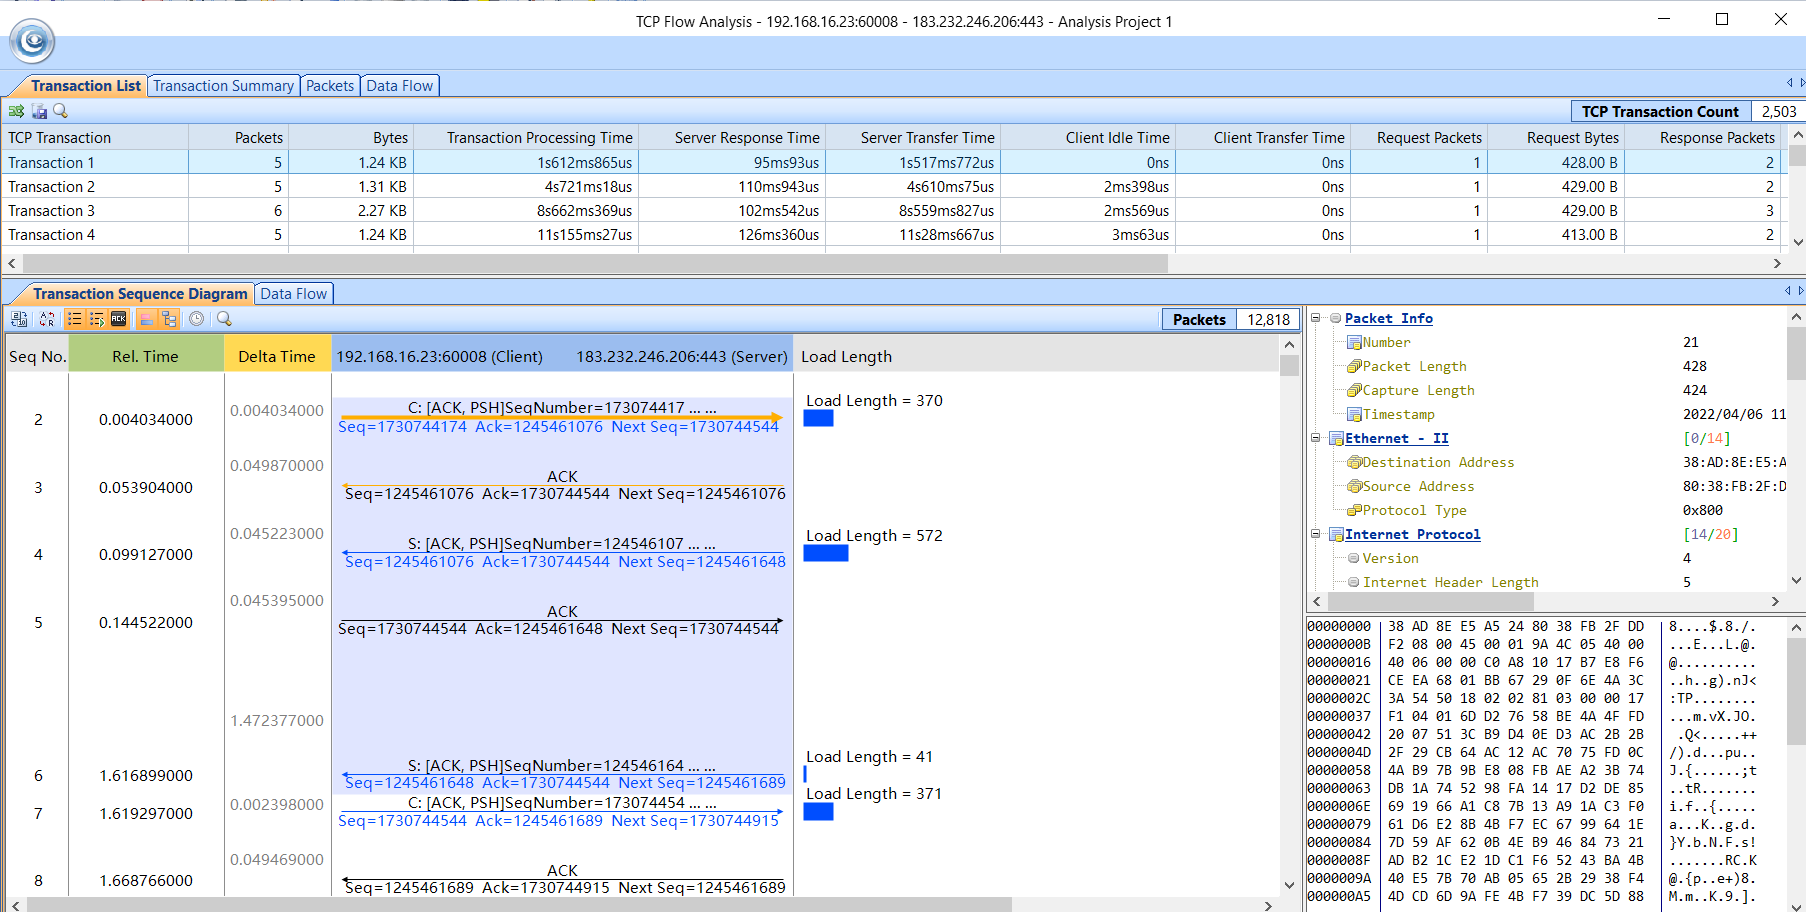
TCP Flow Analysis Window
Open TCP Flow Analysis Window
TCP Flow Analysis Window is based on TCP conversation. Network administrators can open TCP Flow Analysis window by clicking any TCP conversation item in TCP Conversation view of the main user interface.
The TCP Flow Analysis window has a list on the top, which lists all the transactions there. Network administrators can find the packet count number, bytes, duration time and retransmission packet count number, etc. The Transaction Sequence Diagram below will show more details. The arrows show how the packets bounce between the client and server, which make it easy to understand how the transactions go. They find the sequence number, acknowledge number, and it works out next sequence number out as well. And the delta time shows how much time between each packet, so they can tell if the receiver responds quickly and which side is slow to response. Also they can see how much data each transaction carries. Besides, they can see command name if it is HTTP transactions and they tell what pages are requested, or what data the client send to the server.
The Transaction Summary tab gives the statistics of this TCP flow. This is useful when network administrators need to work out a report. It contains more than 30 statistic items on the left. On the right side, it’s a pie chart, which shows how much time each type of action spent during the transactions.
Client/server/network, which one causes the slowdown?
In the TCP Flow Analysis window, network administrators can always start from three-way handshake, the first three packets (SYN, SYN-ACK and ACK packets) for connection setup. The SYN-ACK packet will tell them delta time between SYN and this packet and they know if the SYN packets gets to the server quickly and server responses effectively. For example, network administrators capture at the client side, and they see the client send a SYN to the server and the server takes 500ms or even 1s to respond (the delta time between the two), it’s not the client’s problem.
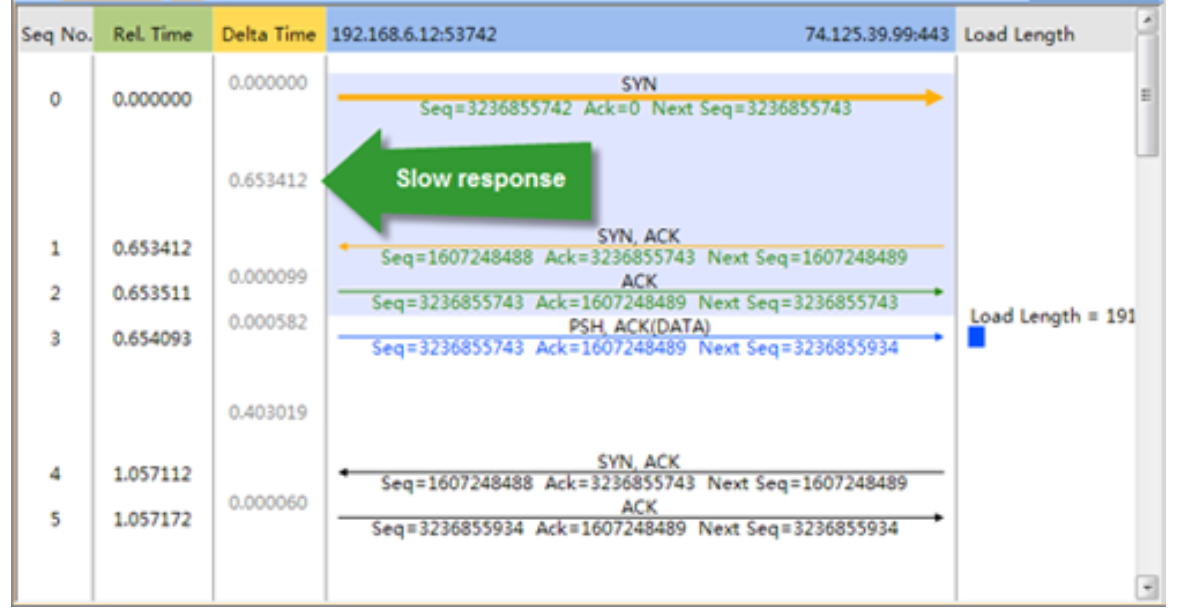
Client is not to blame for the Slow Response
Then network administrators should move on to figure out whether the problem is caused by network or server. If they capture on the server end, they will have opposite answer. So the delta time is useful to clear out who is not responsible for the slowdown. Also focusing on the retransmission packets is important. The retransmission packets will show the network is whether unstable or drops packets somewhere.
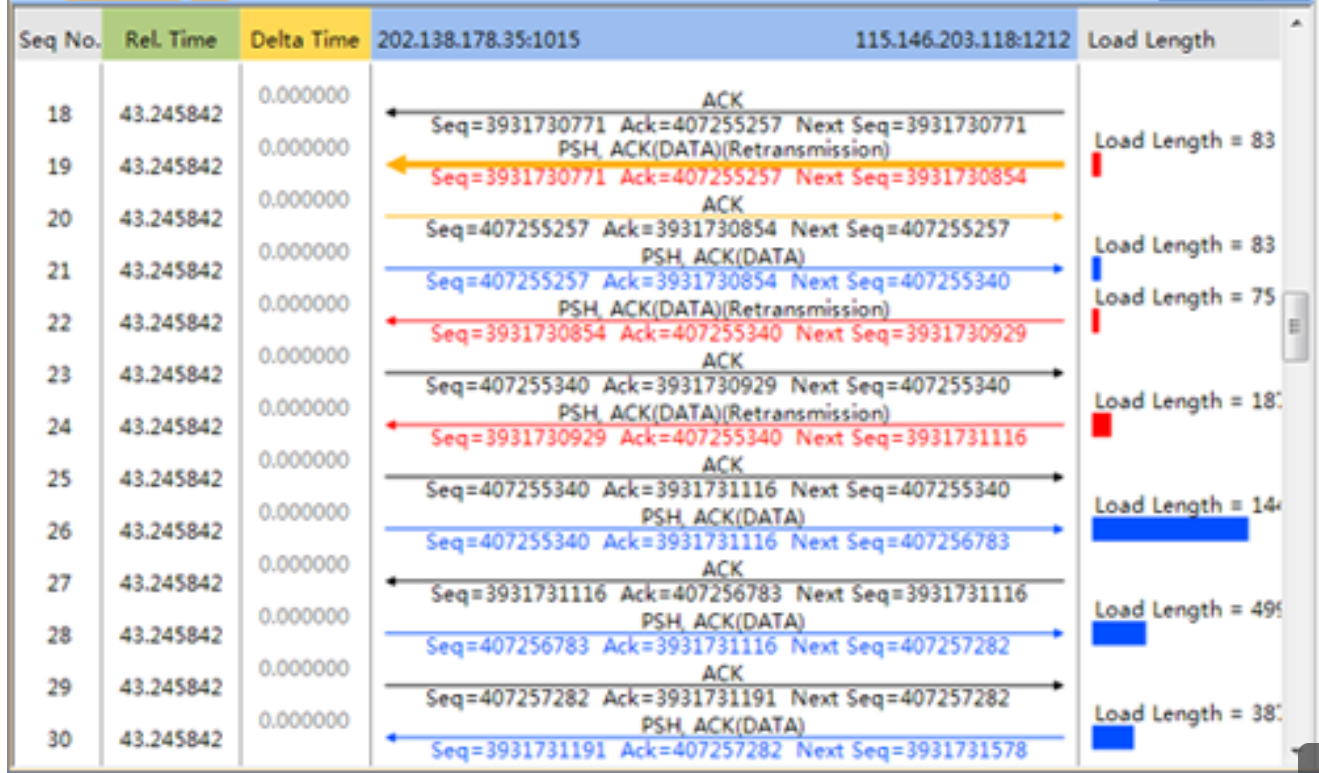
Large volume of retransmissions means poor network performance