Capsa Free Network Analyzer
Capsa Free
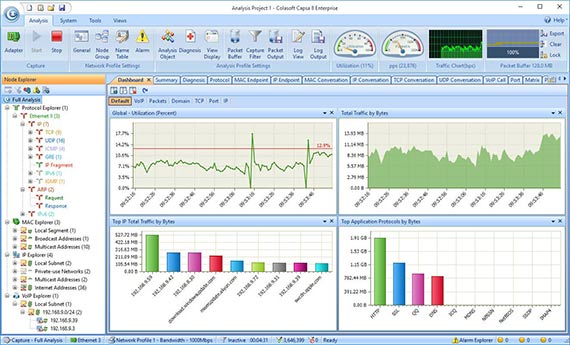
Portable Network Analyzer Freeware for Your LAN Network
Capsa Free is a network analyzer freeware for Ethernet monitoring, troubleshooting and analysis. It provides users with great experience to learn how to monitor network activities, pinpoint network problems, enhance network security. Capsa Free is a special edition of Capsa Network Analyzer for students, teachers and computer geeks to learn protocols and networking technology knowledge.
FREE DOWNLOADCompare Editions
| Key Feature | Capsa Enterprise | Capsa Free |
|---|---|---|
| Price | Paid | Free |
| Trial Download | 30-Day Trial | Download |
| Monitors WiFi Connections |  |
No |
| IP Addresses Monitored | Unlimited | 10 |
| Session Timeout Length | Unlimited | 4 hours |
| Adapter Monitors | |
|
| Manually Save Files | |
|
| Online Auto-update | |
No |
| Run Multiple Projects | |
No |
| Support Multiple Adapters | |
No |
| Support Network TAP | |
No |
| Printing | |
No |
| Export Data | |
No |
| Log Output Function | |
No |
| Fast Speed Packet Replay | |
No |
| Process View | |
No |
| Application View | |
No |
| TCP Port Scan View | |
No |
| VoIP View | |
No |
| Save Reports | |
No |
| Diagnosis Function | |
No |
| Security Analysis Profile | |
No |
| Custom Reports | |
No |
| Packet Auto-output Function | |
No |
| Auto-Scheduling | |
No |
| ARP Attack View | |
No |
| Worm View | |
No |
| DoS Attacking View | |
No |
| DoS Attacked View | |
No |
| Suspicious Conversation View | |
No |
| Trial Download | 30-Day Trial | Download |
| Price | Paid | Free |