nChronos v3 Server and Console Review

Arani Mukherjee
August 28, 2012![]() nChronos, a product of Colasoft, is one of the cutting edge packet/network analysers that the market has to offer today. What we have been promised by Colosoft through their creation is an end to end, round the clock packet analysis, coupled with historical network analysis. nChronos provides an enterprise network management platform which enables users to troubleshoot, diagnose and address network security and performance issues. It also allows retrospective network analysis and, as stated by Colasoft, will "provide forensic analysis and mitigate security risks". Predictably it is a must have for anyone involved with network management and security.
nChronos, a product of Colasoft, is one of the cutting edge packet/network analysers that the market has to offer today. What we have been promised by Colosoft through their creation is an end to end, round the clock packet analysis, coupled with historical network analysis. nChronos provides an enterprise network management platform which enables users to troubleshoot, diagnose and address network security and performance issues. It also allows retrospective network analysis and, as stated by Colasoft, will "provide forensic analysis and mitigate security risks". Predictably it is a must have for anyone involved with network management and security.
Packet analysis has been in the forefront for a while, for the purposes of network analysis; detection of network intrusion; detect misuse; isolate exploited systems; monitor network usage; bandwidth usage; endpoint security status; verify adds, moves and changes and various other such needs. There are quite a few players in this field and, for me, it does boil down to some key unique selling points. I will lay out the assessment using criteria like ease of installation, ease of use, unique selling points and, based on all of the aforementioned, how it stacks up against competition.
Ease of Installation - nChronos Installation
The installation instructions for both nChronos Server and console are straightforward. You install the server first, followed by the console. Setting up the server was easy enough. The only snag that I encountered was when I tried to log onto the server for the first time. The shortcut created by default runs the web interface using the default web browser. However, it calls 'localhost' as the primary link for the server. That would bring up the default web page of the physical server on which nChronos server was installed. I was a bit confused when the home page of my web server came up instead of what I was expecting. But one look into the online help files and the reference on this topic said to try 'localhost:81' as an option and, if that doesn't work, try 'localhost:82'. The first option worked straight away, so I promptly changed the shortcut of nChronos server to point to 'localhost:81'. Voila, all was good. Rest of the configuration was extremely smooth, and the run of events followed exactly what was said in the instruction manual. For some reason at the end of the process the nChronos server is meant to restart. If by any chance you receive an error message in the lines of the server not being able to restart, it's possibly a glitch. The server restarted just fine, as I found out later. I went ahead to try the various installation scenarios mentioned and all of them worked just as fine.
Once the server was up and running, I proceeded to install the nChronos Console, which was also straightforward. It worked the first time, every time. With the least effort I was able to link up the console with the server and start checking out the console features. And yes, don't forget to turn the monitoring on for the network interfaces you need to manage. You can do that either from the server or from the console itself. So all in all, the installation process passed with some high grades.
Ease of Use
Just before starting to use the software I was getting a bit apprehensive about what I needed to include in this section. First I thought I would go through the explanation of how the software works and elaborate on the technologies used to render the functionalities provided. But then it occurred to me that it would be redundant for me to expand on all of that because this is specialist software. The users of this type of software are already aware of what happens in the background and are well versed with the technicalities of the features. I decided to concentrate on how effectively this software helps me perform the role of network management, packet tracing and attending to issues related to network security.
The layout of the nChronos Server is very simple and I totally agree with Colasoft's approach of a no nonsense interface. You could have bells and whistles added but they would only enhance the cosmetic aspect of the software, adding little or nothing to its function.
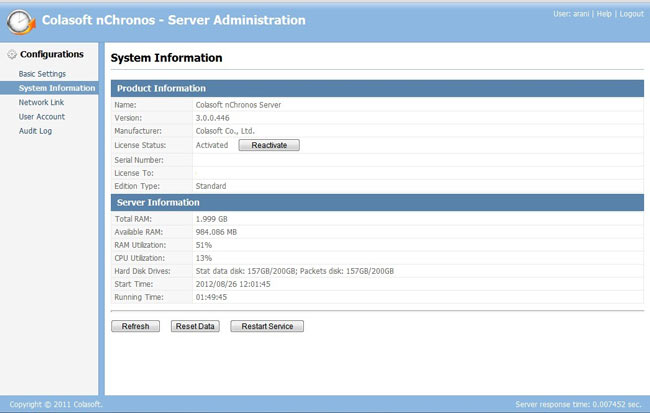
The screenshot above gives you an idea of what the Server Administration page looks like, which is the first page that would open up once the user has logged in. This is the System Information Page. On the left pane you will find several other pages to look at i.e. Basic Settings which displays default port info and HDD info of the host machine, User Account (name says it all), and Audit Log (which will basically show the audit trail of user activity.)
The interesting page to look at is Network Link. This is where the actual interfaces to be monitored are added. The screenshot below shows this page:
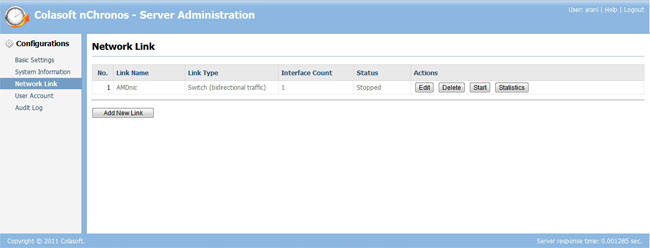
Obviously for the purpose of this review the only NIC registered on the server was the NIC of my own machine. This is the page from where you can start monitoring of the various network interfaces all over your network. Packet data for any NIC would not be captured if you haven't clicked on the 'Start' button for the specific NIC. So don't go about blaming the car not starting up when you haven't even turned the ignition key!!!
All in all, it's simple and it's effective as it gives you less chances of making any errors.
Now that the server is all up and running we use the nChronos Console to peer into the data that it is capturing:
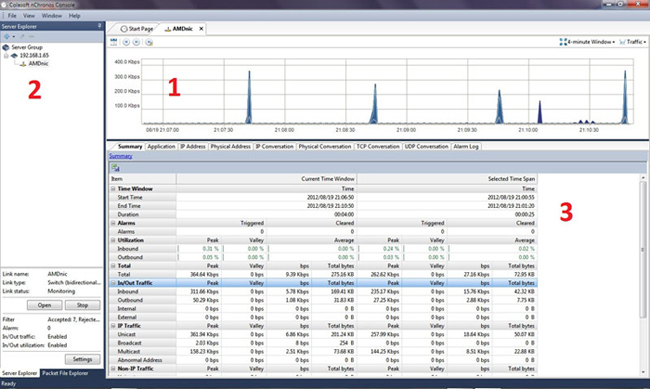
The above screenshot shows the console interface. For the sake of simplicity I have labelled three separate zones, 1, 2, and 3. When the user logs in the for first time, he/she has to select the interface that needs to be looked at from zone 2 and click on the 'Open' button. That then shows all the details about that interface in Zones 1 and 3. Notice in Zone 1 there is a strip of buttons, one of which is the auto-scroll feature. I loved this feature as it helps you the see traffic as it passes through. To see a more detailed data analysis you simply click drag and release the mouse button to select a time frame. This unleashes a spectrum of relevant information in Zone 3. Each and every tab displays the packets captured through a category window, e.g. The application tab will show the types of application protocols have been used in that time frame i.e. HTTP, POP, etc.
One of the best features I found was the ability to parse each line of data under any tab by just double clicking on it. So if I double clicked the link on the application tab that says HTTP, it would drill down to IP Address. I can keep on drilling down and it would traverse from HTTP -> IP Address -> IP Conversation -> TCP Conversation. I can jump to any specific drill down state by right clicking on the application protocol itself and making a choice on the right click menu. This is a very useful feature. For the more curious, the little spikes in traffic in zone 1 was my mail application checking for new mail every 5 seconds.
The magic happens when you right click on any line of data and select 'Analyse Packet'. This invokes the nChronos Analyzer:
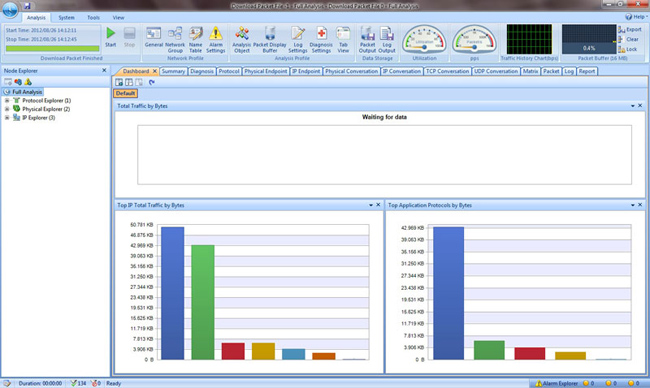
The above screenshot shows what the Analyzer looks like by default. This was by far my favourite tool. The way the information about the packets was shown was just beyond belief. This is one example where Colasoft has shown one of its many strengths, where it can combine flamboyance with function. The list of tabs on the top will give you an idea of how many ways the Analyzer can show you the data you want to see. Some of my favourites were the following: Protocol
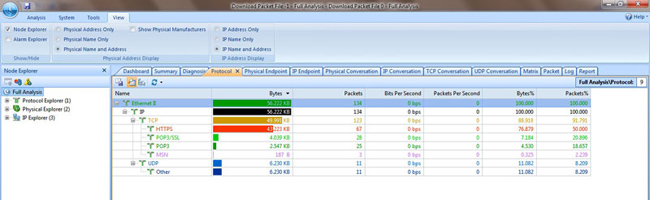
his is a screenshot of the Protocol Tab. I was impressed with seeing the number of column headers that were being used to show detailed information about the packets. The tree-like expanded way of showing protocols under particular data units, based on the layers involved, was useful.
Another one of my favourite tabs was the Matrix:
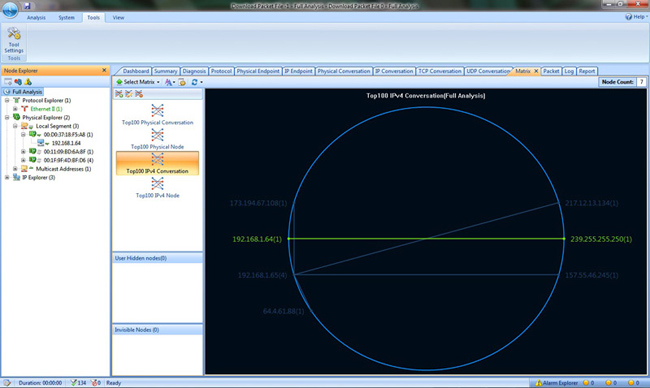
The utility of this tab is to show the top 100 end to end conversions which can be IP conversions, physical conversions etc. If you double click any of those lines denoting a conversion it opens up an actual data exchange between the nodes. This is very important for a network manager if there is a need to decipher what exact communication was ensuing between to nodes, be it physical or IP, for a given point of time. It can be helpful in terms of checking network abuse, intrusions etc.
This brings me to my most favourite tab of all, the Packet tab. This tab will show you end to end data being exchanged between any two interfaces and show you exactly what data was being exchanged. I know most packet analyzers primary function is to be able to do that but I like Colasoft's treatment of this functionality:
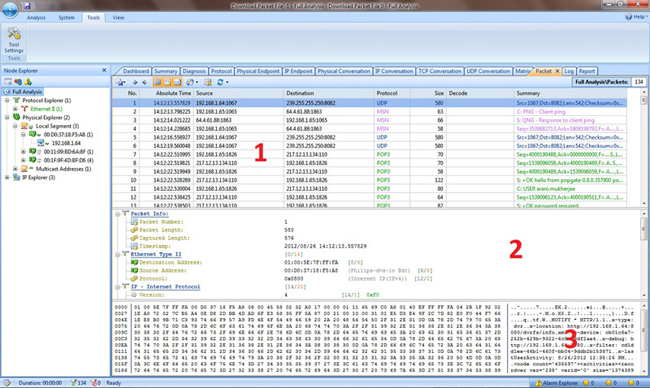
I took the liberty of breaking up the screen into three zones to show how easy it was to delve into any packet. In zone 1, you would select exactly which interchange of data between any concerned nodes you want to splice. Once you have done that, zone 2 starts showing the packet structure in terms of the difference network protocols i.e. Data link layer, Network Layer, Transport Layer, Application Layer etc. Then zone 3 shows you the actual data that was encapsulated inside that specific packet. This is by far the most lucid and practical approach I have seen by any packet analyzer software when showing encapsulated data within packets. I kid you not, I have seen many packet analyzers and Colasoft trumps the lot.
Conclusion
Colasoft's unique selling points will always remain simplicity, careful positioning of features to facilitate easy access for users, presentation of data in a non-messy way for maximum usage and, specially for me, making me feel like a Crime Scene Investigator of networks, like you might see on CSI-Las Vegas (apologies to anyone who is hasn't seen the CSI series).
Network security has become of paramount importance to us in our daily lives as more and more civil, military and scientific work and facilities are becoming dependant on networks. For a network administrator it is not only important to resume normalcy of network operations as soon as possible but also to go back and investigate successfully why an event, capable of crippling a network, might have happened in the first place. This is also applicable in terms of preventing such a disruptive event. Colasoft's nChronos Server and Console coupled with Analyzer is an assorted bundle of efficient software which helps to perform all the function required to preserve network integrity and security. It is easy to setup and maintain, requires minimum intervention when it's working and delivers vast amounts of important information in the easiest manner possible. This software bundle is a must-have for any organisation which, for all the right reasons, values its network infrastructure highly, and wants to preserve its integrity and security.