How to Configure a TCP Transaction
In nChronos 5.2, a new feature, TCP transaction analysis, is provided. TCP transaction analysis allows users to define the transaction by configuring the protocol on the application level. And this would make transaction identification and analysis more accurate.
Configuration Steps
Here we take HTTP transaction as an example to show how to configure a TCP transaction.
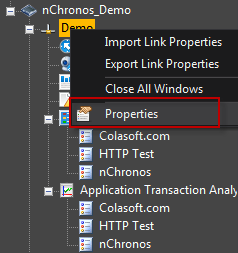
1. Right click on the link and select Properties.
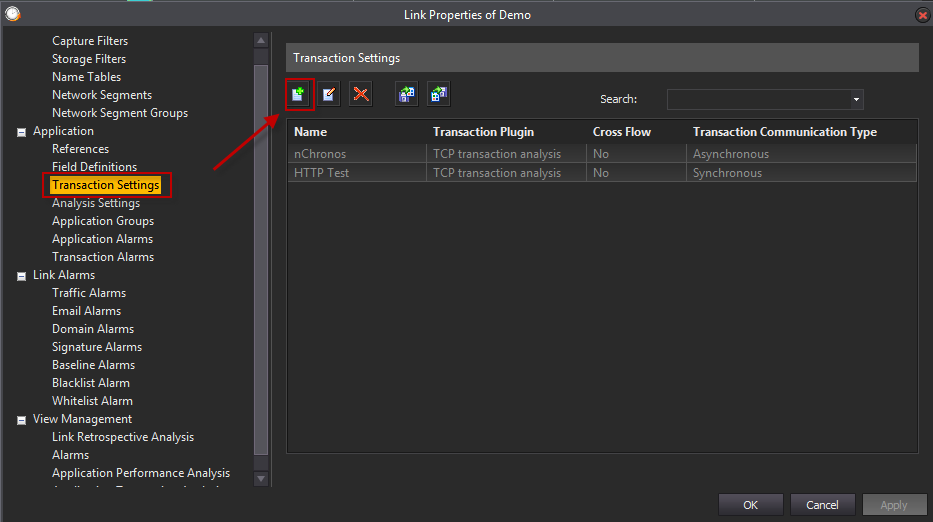
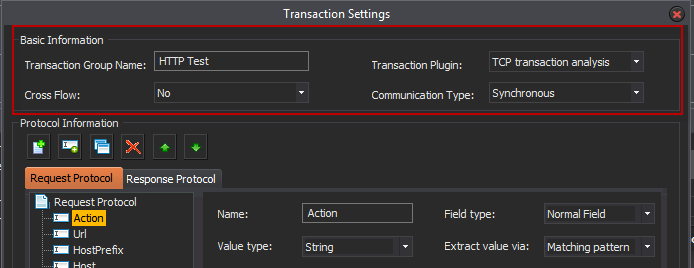
2. Go to the Transaction Settings tab, and click the Add button to add a new transaction.
3. Fill the Basic Information.
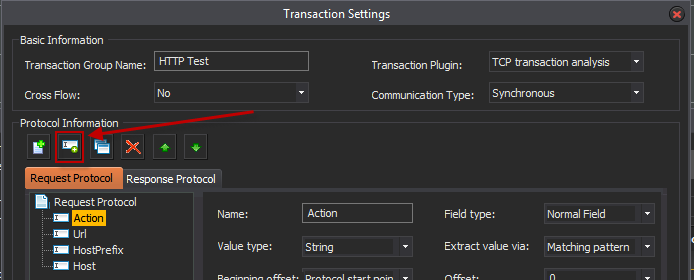
4. Configure the Protocol Information.
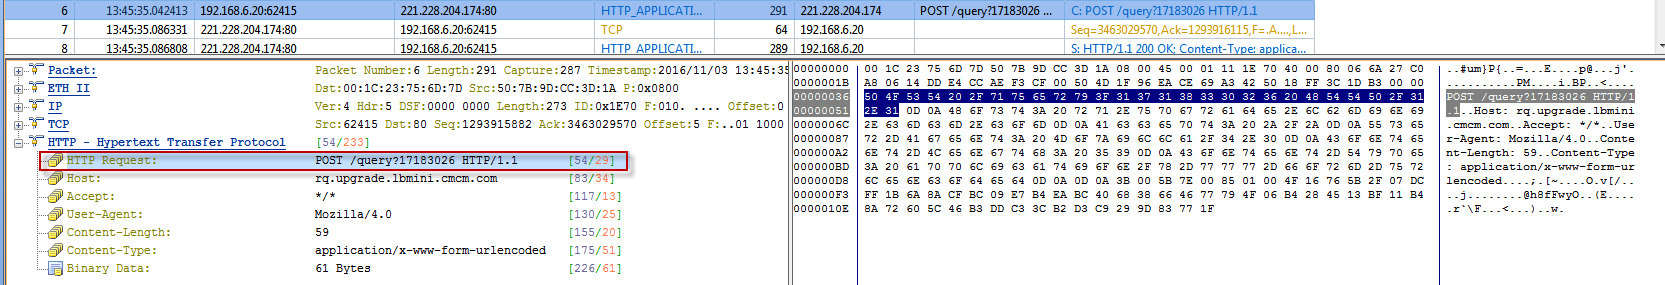
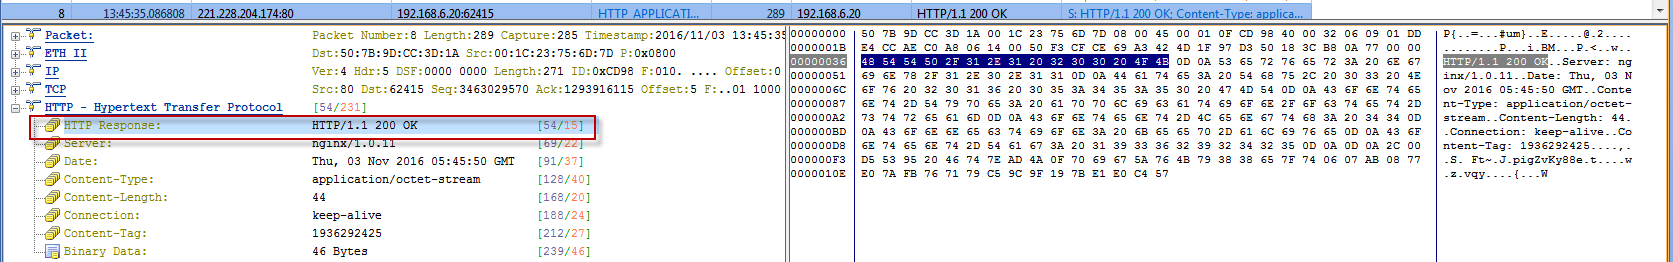
In order to configure a TCP transaction, you need to be really familiar with the networking protocols patterns. In order to check a protocol patterns, you could use the nChronos build-in expert analysis tool to see the details of a packet communicating through a certain protocol. Here, we take the HTTP as an example.
a. Click the Add button to add a field.
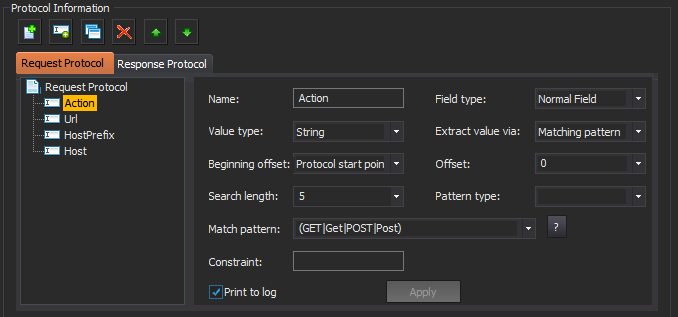
b. Add the field, "Action", for Request Protocol.
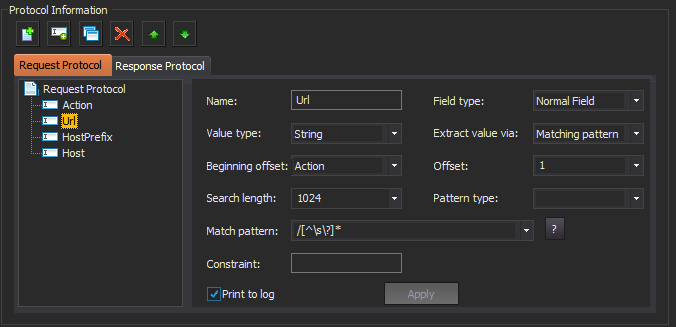
c. Add the field, "Url", for Request Protocol.
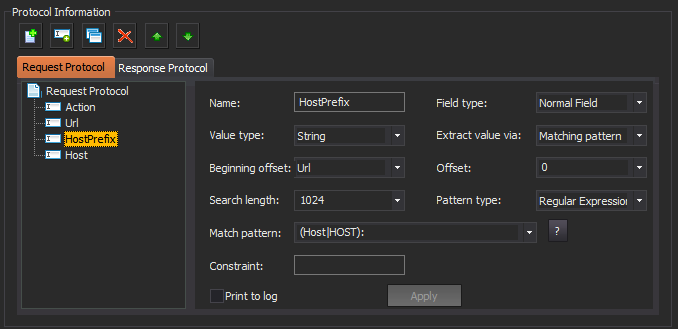
d. Add the field, "HostPrefix", for Request Protocol.
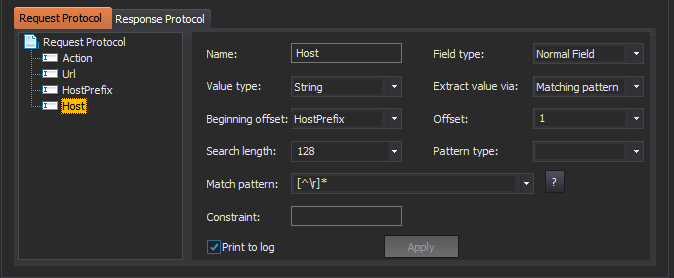
e. Add the field, "Host", for Request Protocol.
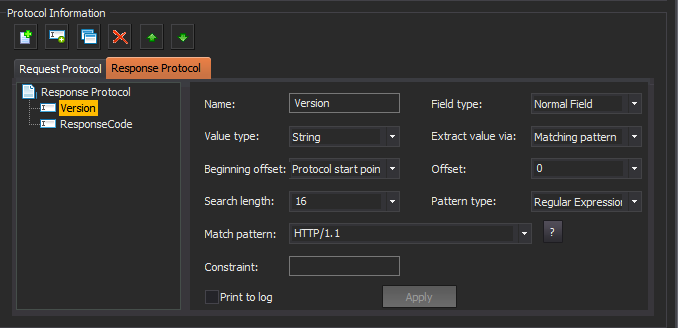
f. Add the field, "Version", for Response Protocol.
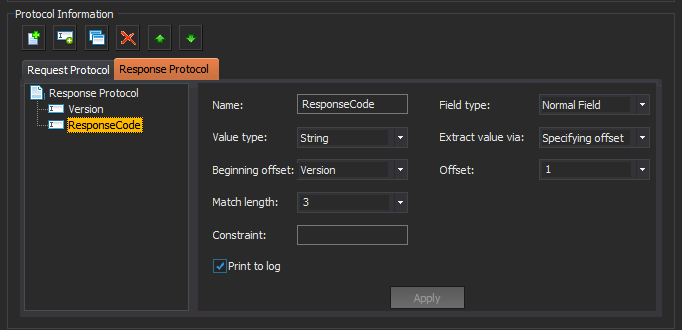
g. Add the field, "ResponseCode", for Response Protocol.
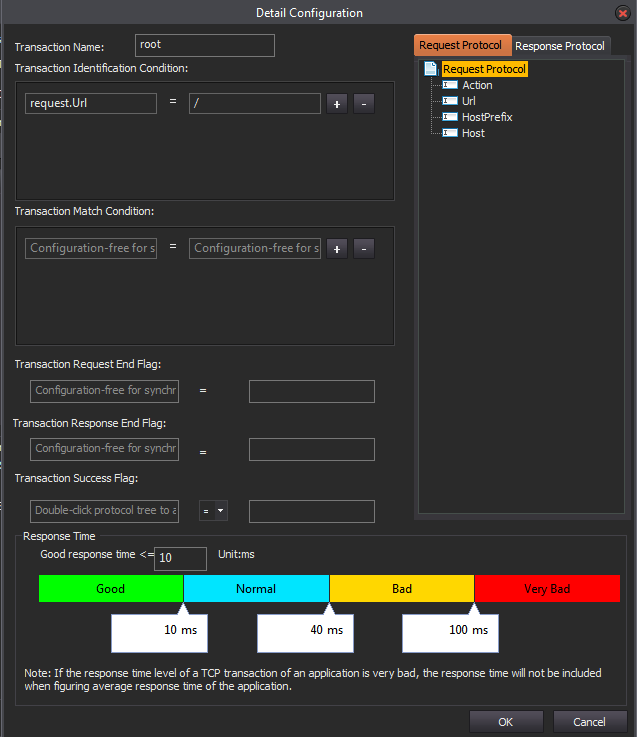
5. Configure the Transaction Information.
a. Click the Add button.
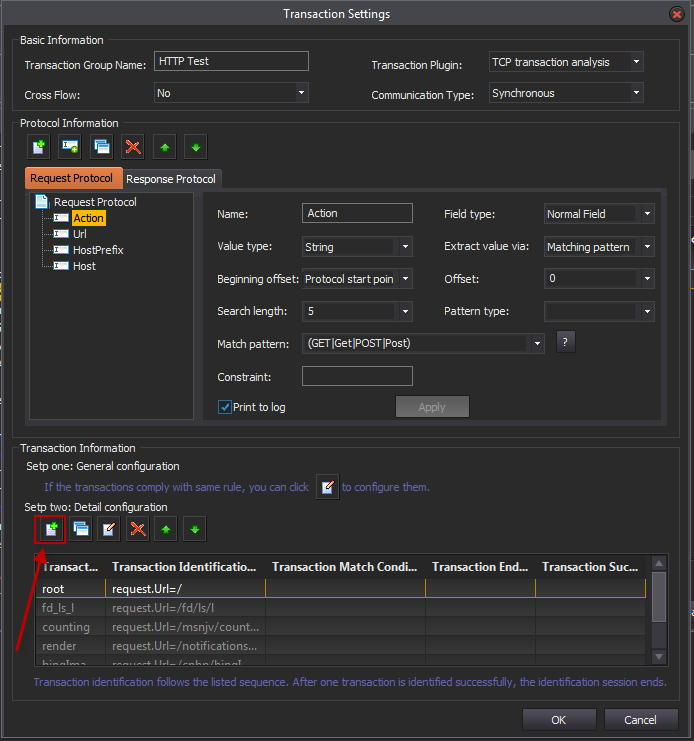
b. Add a transaction, "root".
c. Add a transaction, "fd_ls_l".

d. Add a transaction, "counting".

e. Add a transaction, "render".

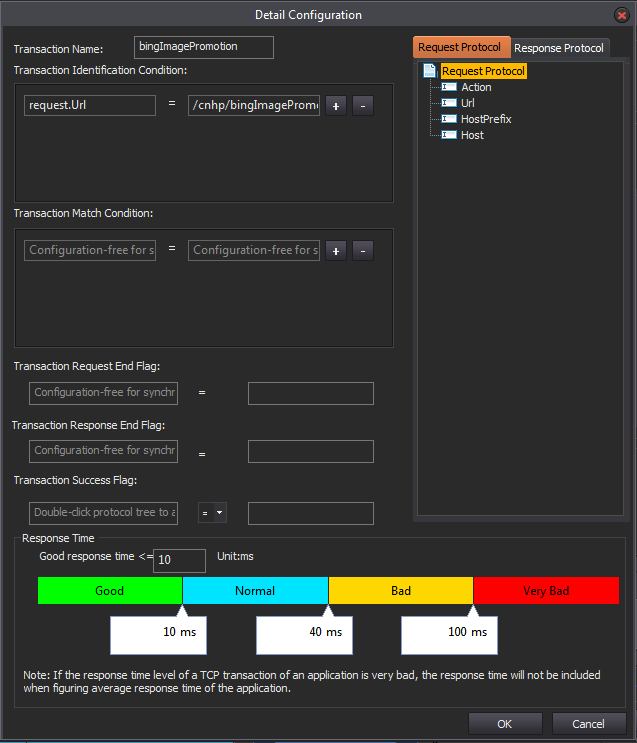
f. Configure a transaction, "bingImagePromotion".
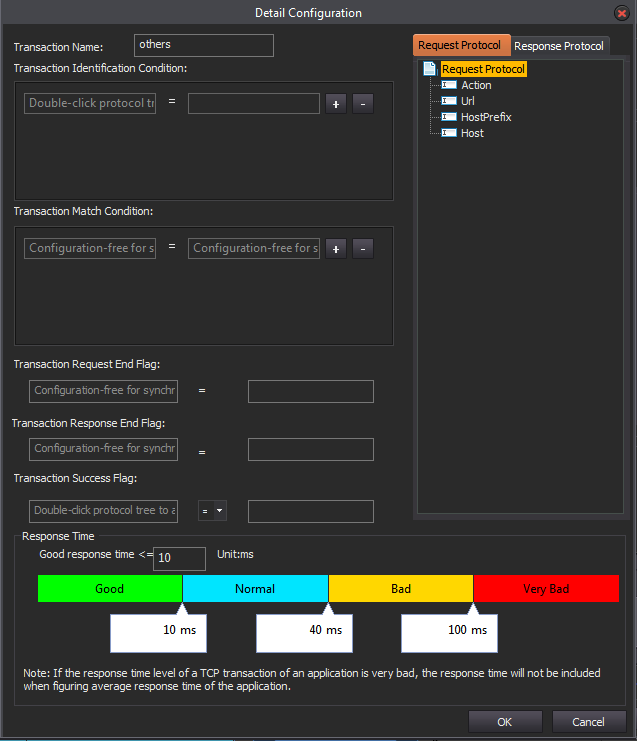
g. Add a transaction, "others".
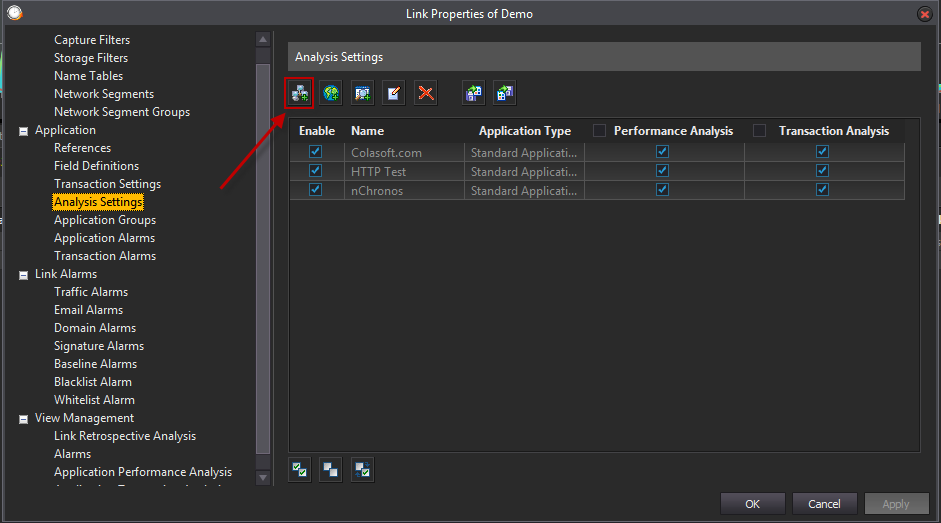
6. Save the configuration and go to the Analysis Settings tab. Click New Standard Application button.
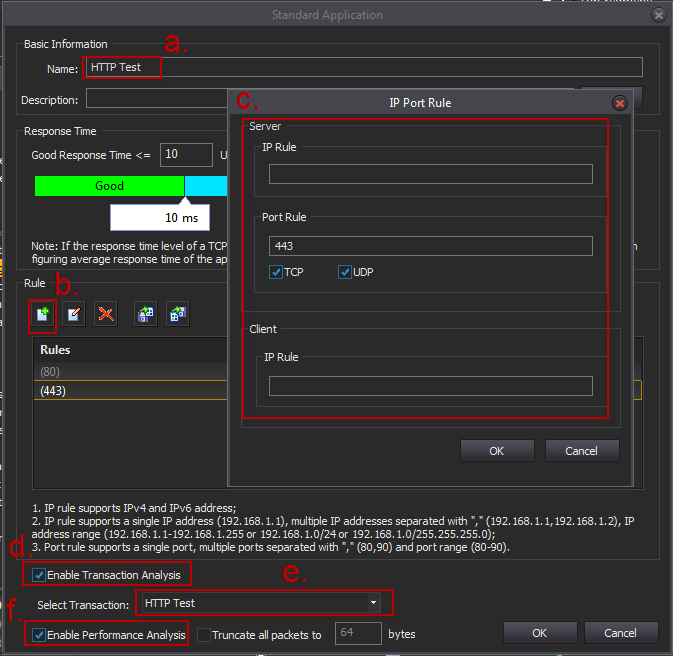
7. Configure the Standard Application.
a. Put the name for this application.
b. Click the Add button.
c. Put the Server IP and Port and the Client IP that you want to monitor.
d. Check the box to enable transaction analysis.
e. Select HTTP Test which we just configured.
f. Check the box to enable performance analysis.
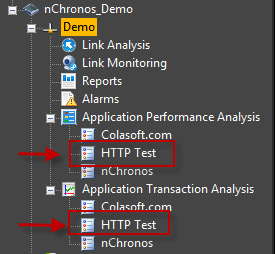
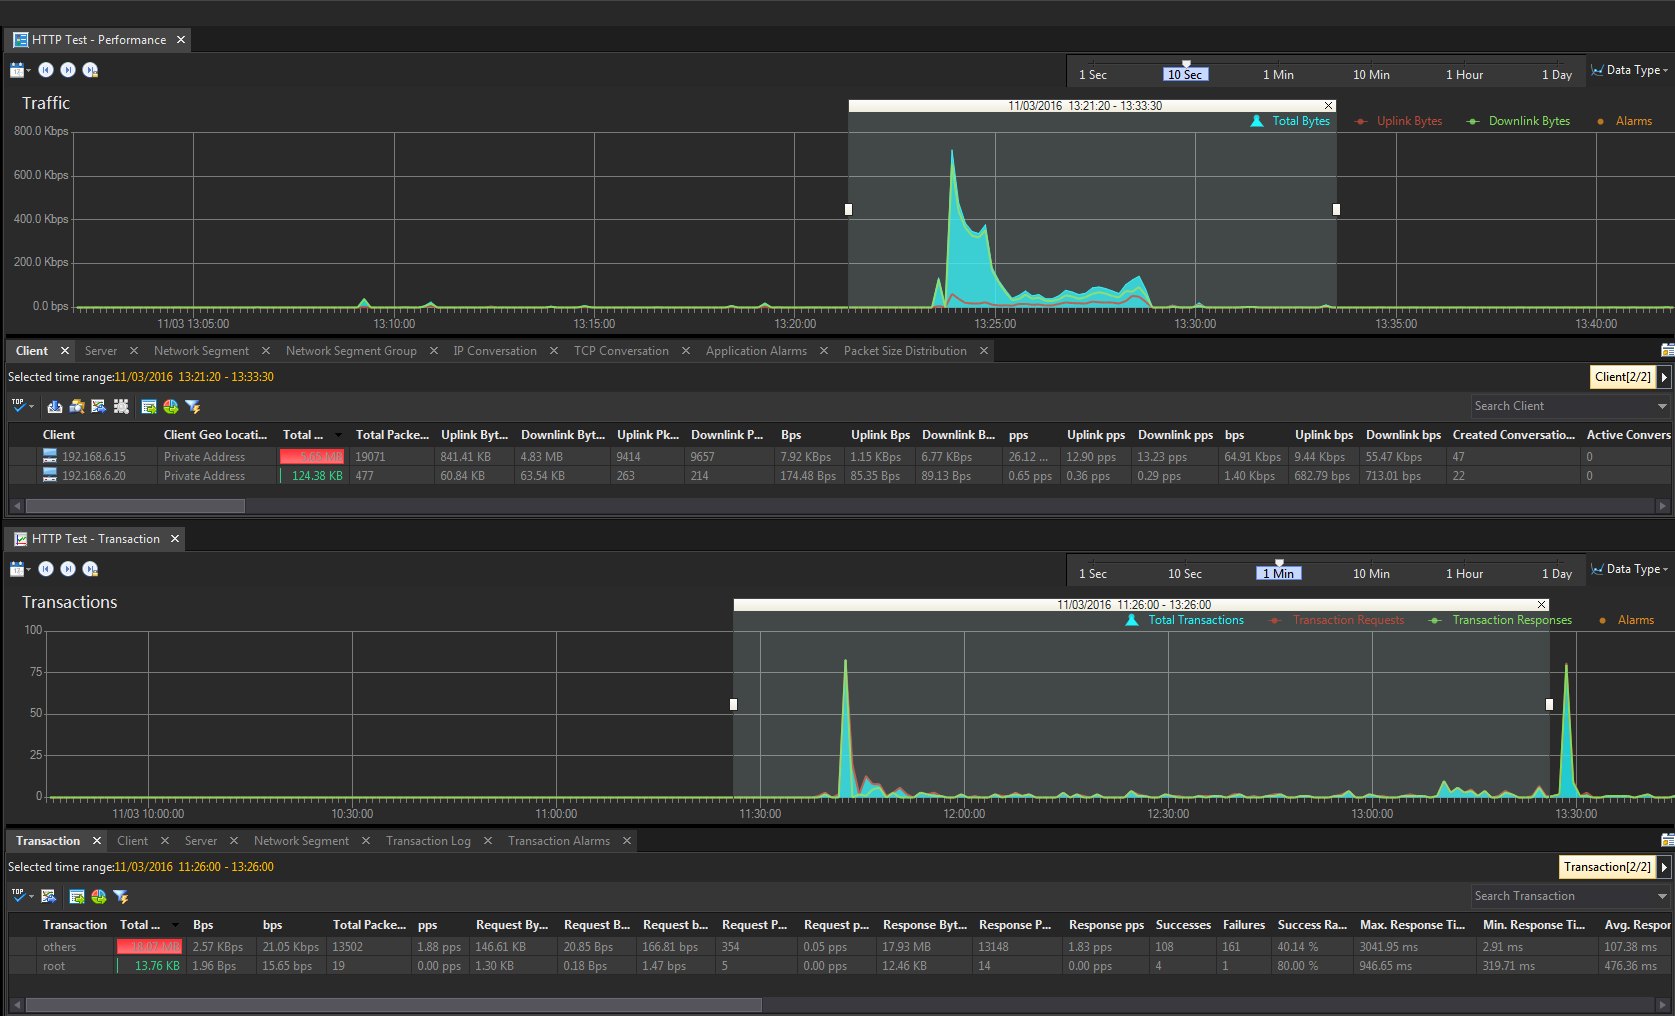
8. Till this point, you already finished a TCP transaction configuration. Click the HTTP Test under the Application Performance Analysis and Application Transaction Analysis to monitor the HTTP transaction.