What's New in nChronos
What's New in nChronos 6.2
Support Sublink Alarm
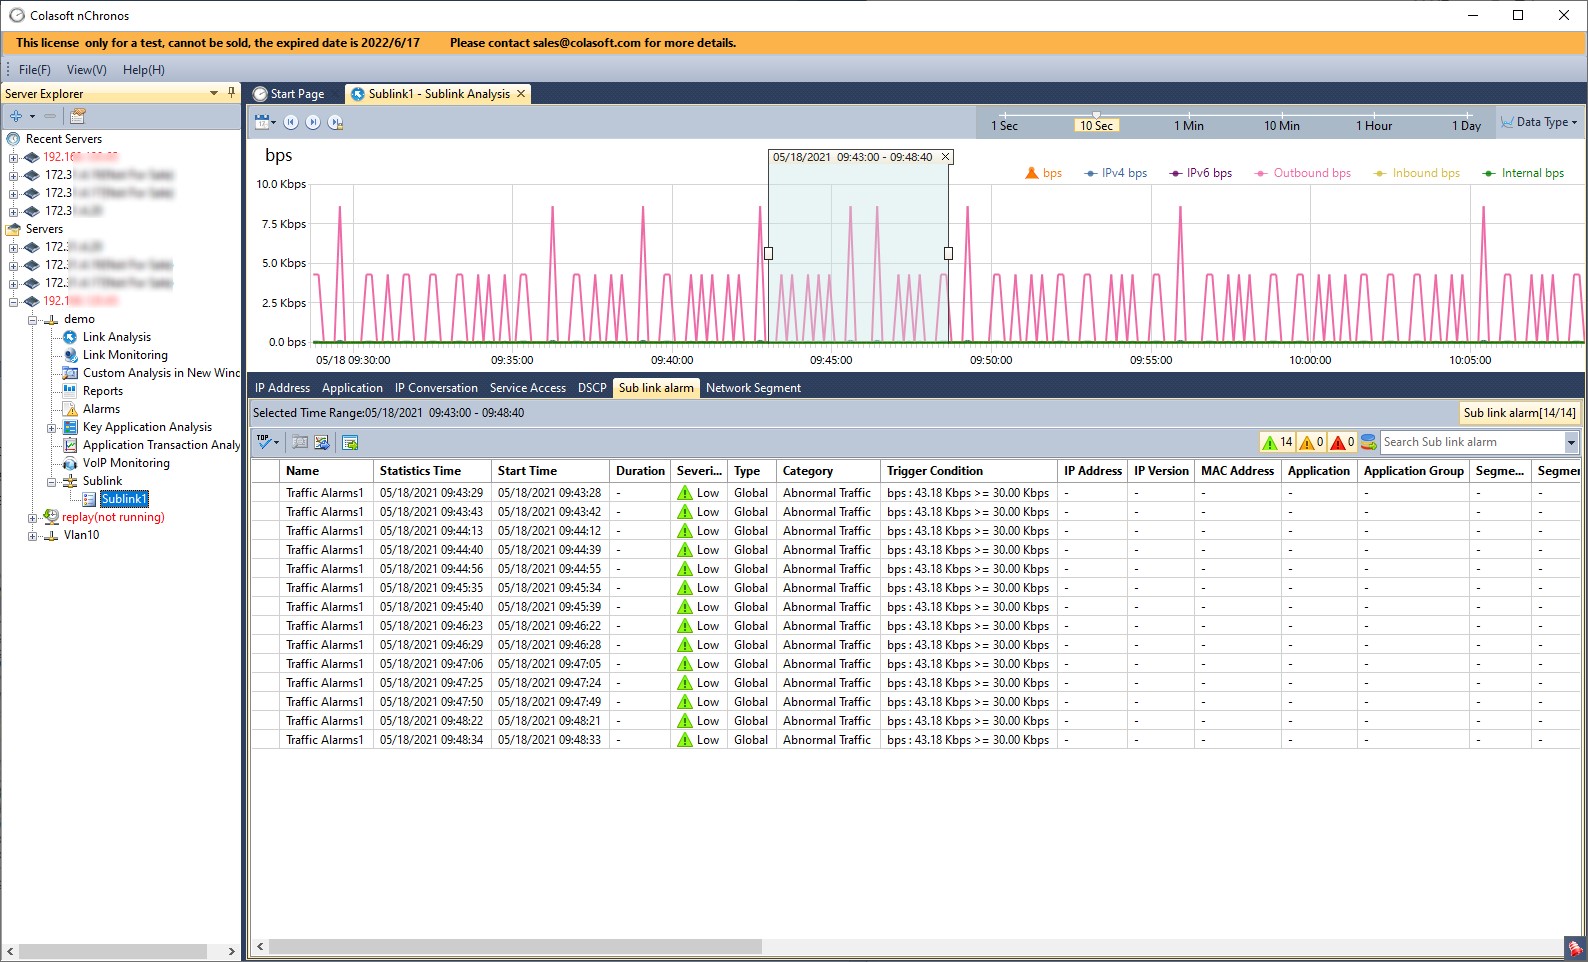
nChronos 6.2 supports to set traffic alarms for sublinks. Sublinks can be configured based on VLAN, ISL VLAN, VXLAN, MPLS VPN, MAC address and network segment. When users want to set an alarm for a sublink, they need to select the specific sublink on the alarm adding box, then finish the settings. When the condition is triggered, the alarm details will be shown under sublink alarm tab.
Fully Support for IPv6
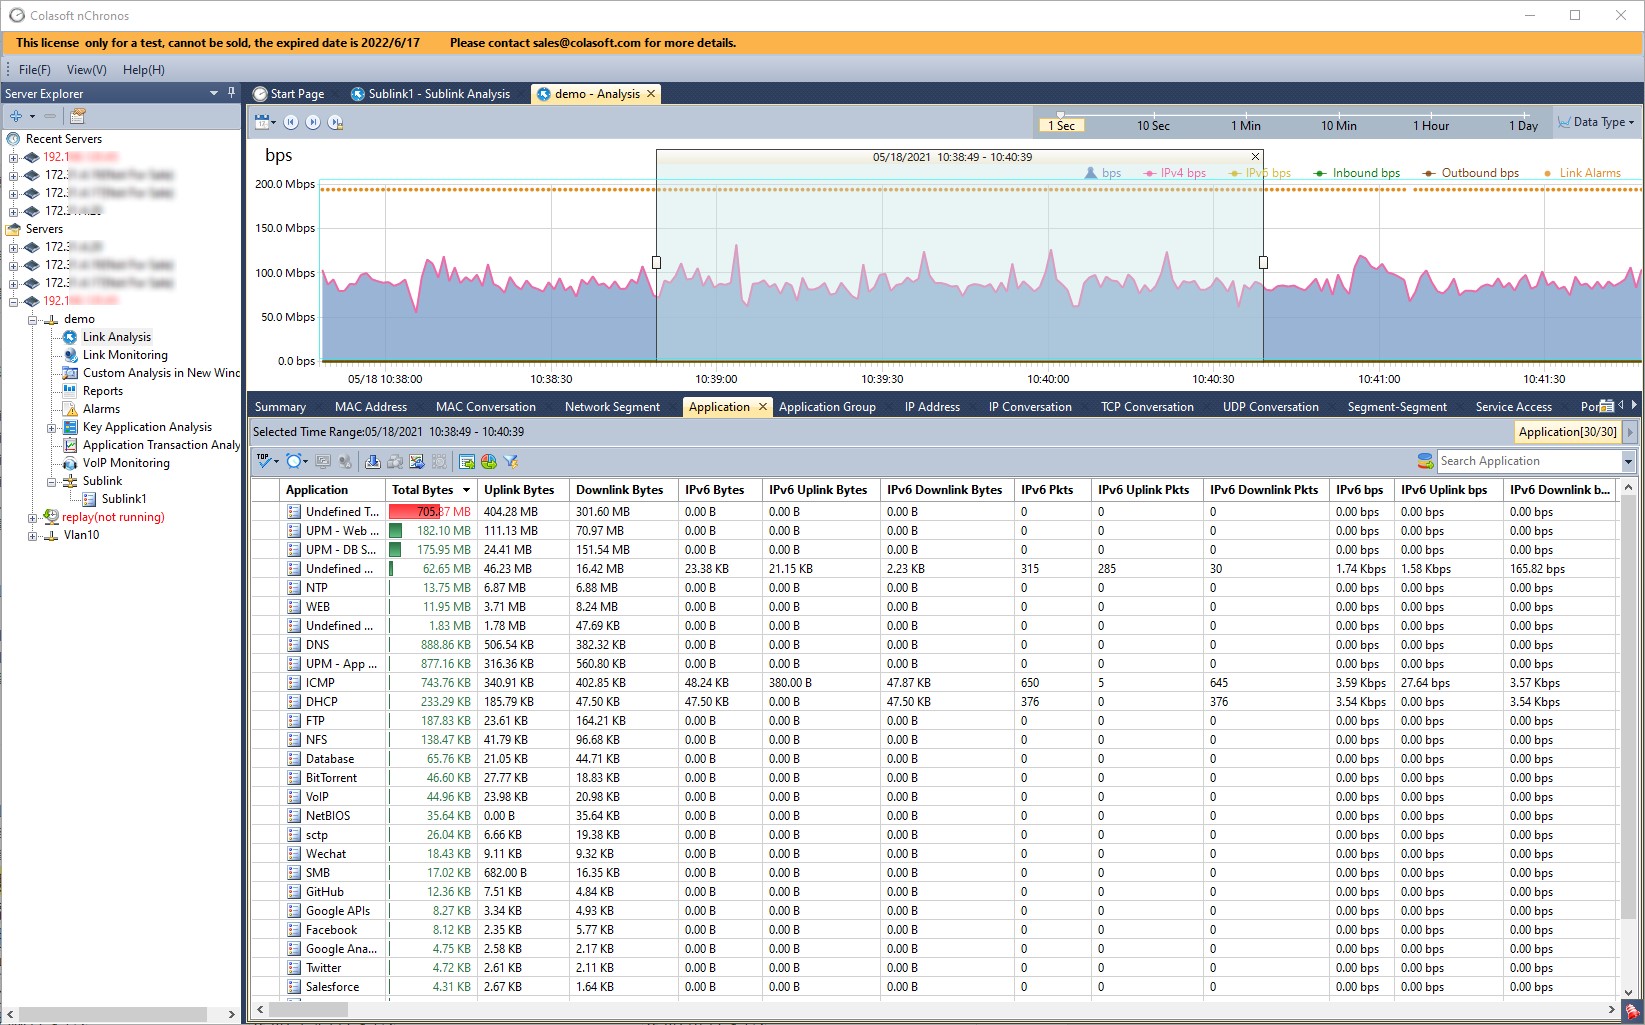
In various industries, especially the financial industry, IPv6 is gradually being used. nChronos 6.2 now fully supports IPv6. IPv6 is supported in DPDK capture interface configuration, management interface configuration, communication with UPM configuration, SMTP configuration, Syslog configuration, third-part login authentication configuration, security strategy configuration, agent configuration, audit log and client tools. Besides, multiple IPv6 related metrics are added to summary tab, application/application group tab and virtual network tab, including IPv6 bps, IPv6 Pkts, IPv6 Bytes, etc.
What's New in nChronos 6.0
Server List Information & Login Information Migration
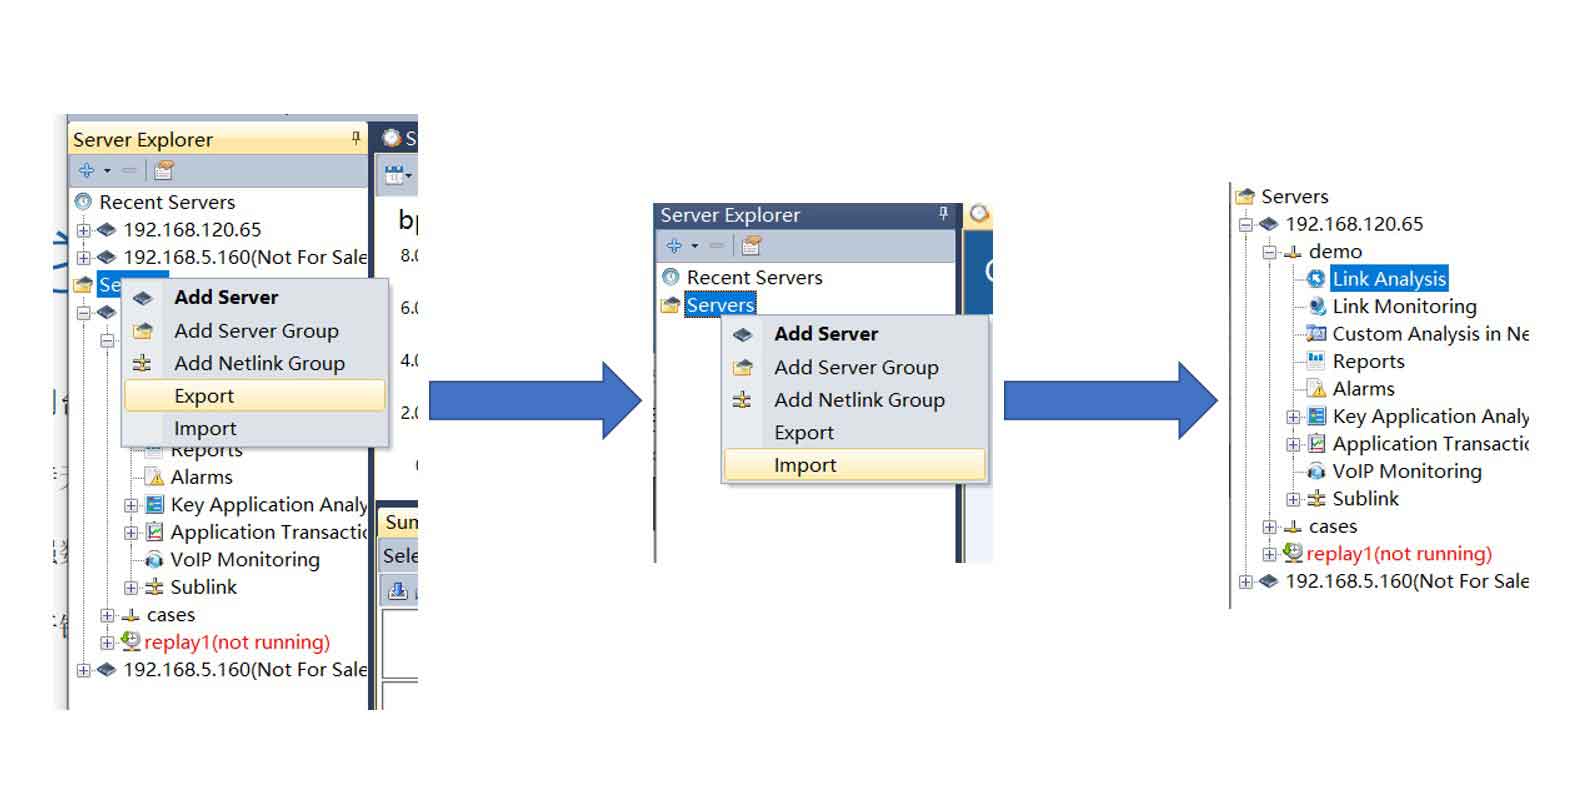
nChronos 6.0 added server information migration. In a team, there may be many members who need to login to the servers from the consoles on their computers, but it is inconvenient to add information from multiple servers to the console one by one. With this new function, users can import the server information from other console, which can improve work efficiency.
Optimized Packet Truncating
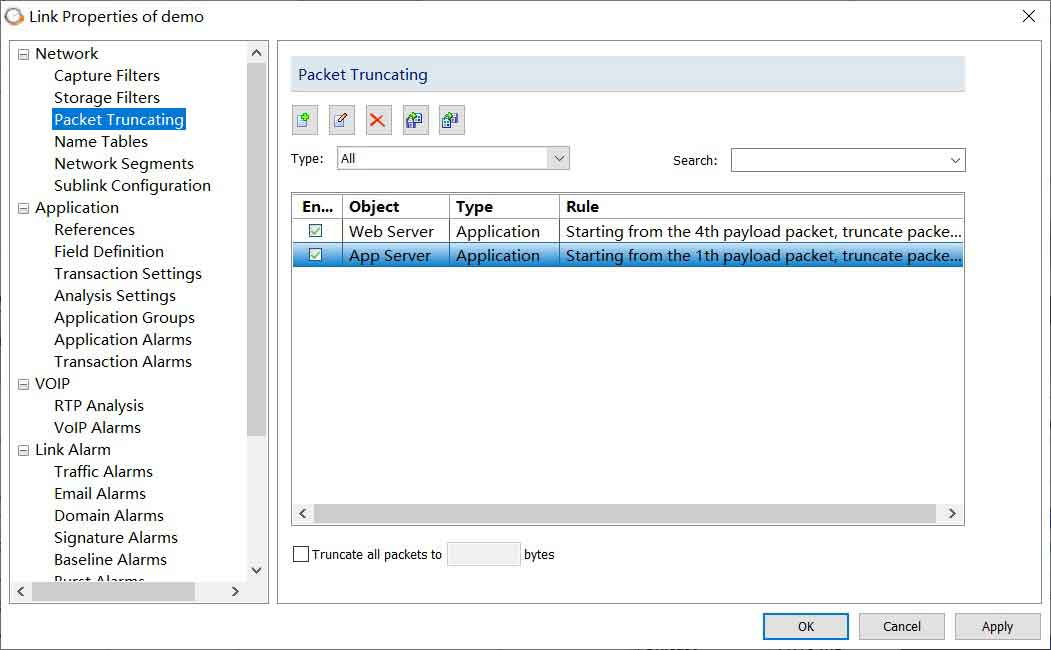
Sometimes, it is not necessary to store all packet bytes. By discarding low-value bytes we can save server storage. nChronos 6.0 optimizes packet truncating, making it more powerful, flexible, and easy to use. On Console, there is a new tab “Packet Truncating” for configuring packet truncating rules based on application, protocol and VLAN.
What's New in nChronos 5.6
Custom analysis in new window
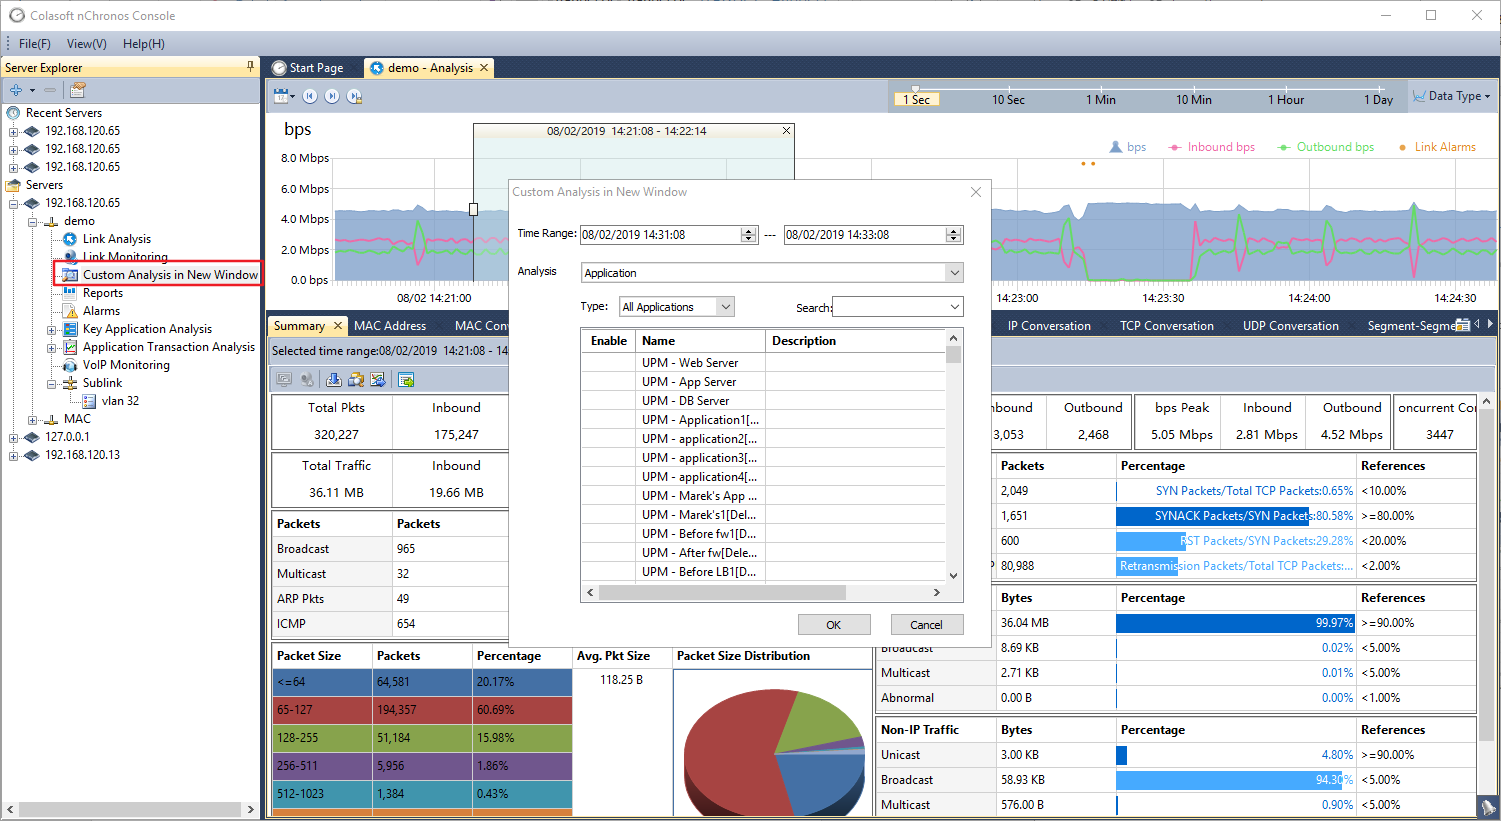
nChronos 5.6 provides a feature for retrospective analysis of defined objects. Users can select or input objects for retrospective analysis according to their needs. This function is similar to Analysis in New Window, but it is faster and more convenient.
There are many tabs to display different metrics for the selected objects analysis. Different metrics correspond to different analysis objects. In IP Conversation tab, users can view all the IP conversations. Double click the conversation to drill down for more information about this conversation.
Sublink configuration feature
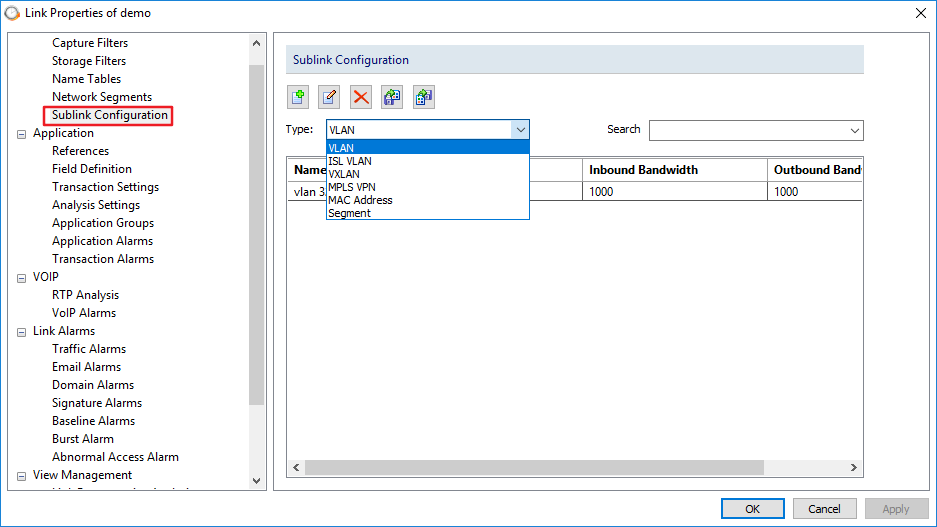
nChronos 5.6 provides a sublink configuration feature, which is used to configure sublinks. Users can define sublink with seven types, VLAN, ISL VLAN, VXLAN, MPLS VPN, MAC address, NetFlow flag and network segment.
It's helpful for users to more conveniently manage and monitor virtual network statistics data and network segment data in the network environment.
Burst alarm type
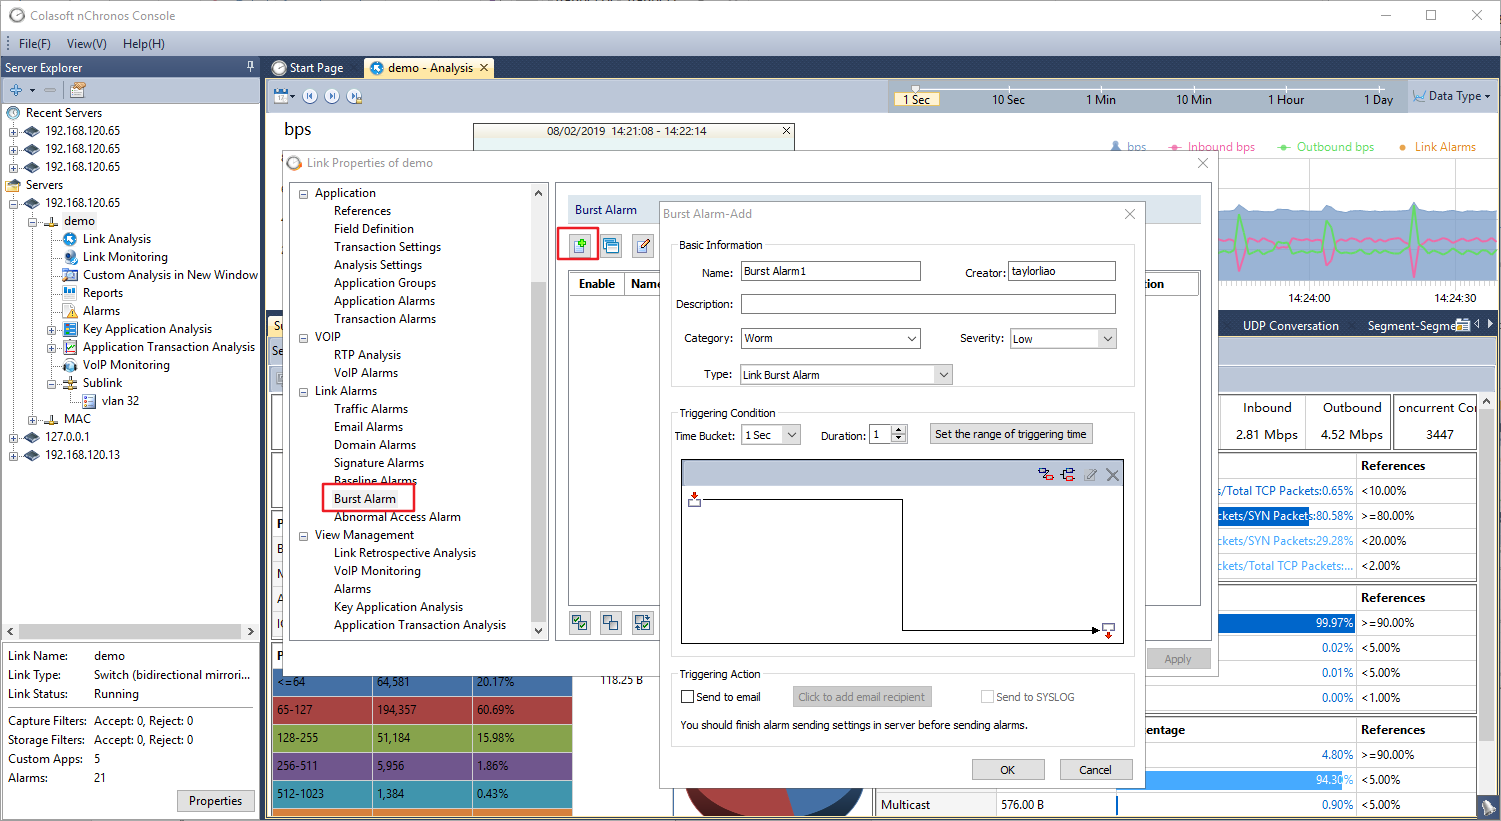
nChronos 5.6 provides a burst alarm type. Burst alarm is used to warn of abnormal burst. In order to improve the accuracy of alarm, the system will compare the captured data with those of the previous N cycles. At the same time, the captured data can be also compared with the baseline data and index threshold data. A single alarm can include multiple alarm conditions. Users can set it to send the alarm log to mails or SYSLOG servers.
Port view
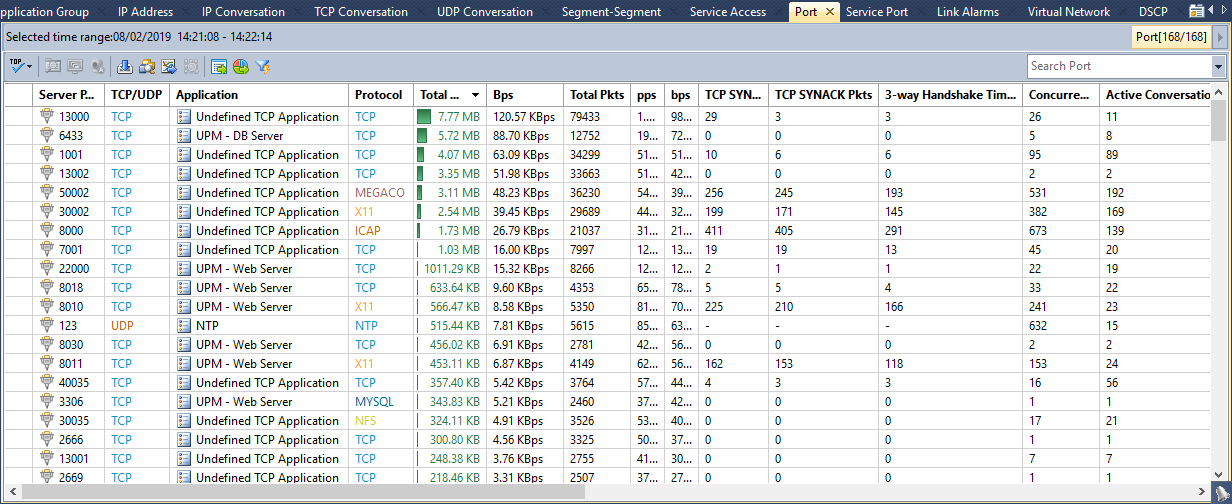
nChronos 5.6 provides port statistics table to count and display the port information of selected time range. In this view, users can drill down one or multiple ports to analyze selected ports deeper. By drilling down selected ports, users can get more information related ports. Double click a port to drill down for more information about this port.
NETFLOW Interface summary
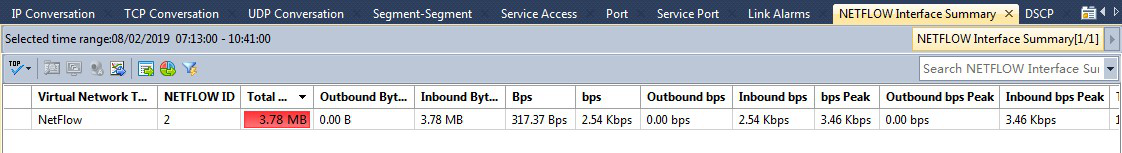
nChronos 5.6 provides NETFLOW interface summary table to count and display the NETFLOW interface information of selected time periods. In this view, users can drill down one or multiple NETFLOW interfaces to analyze selected interfaces deeper. Users also can do retrospective analysis of selected NETFLOW interfaces.
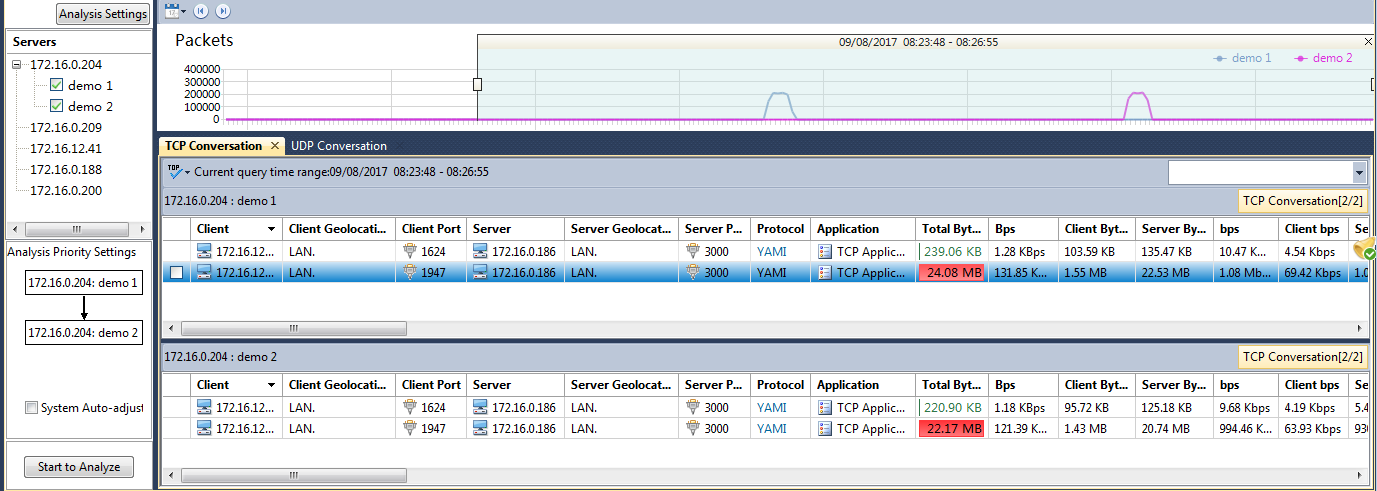
TCP conversations retrospective analysis
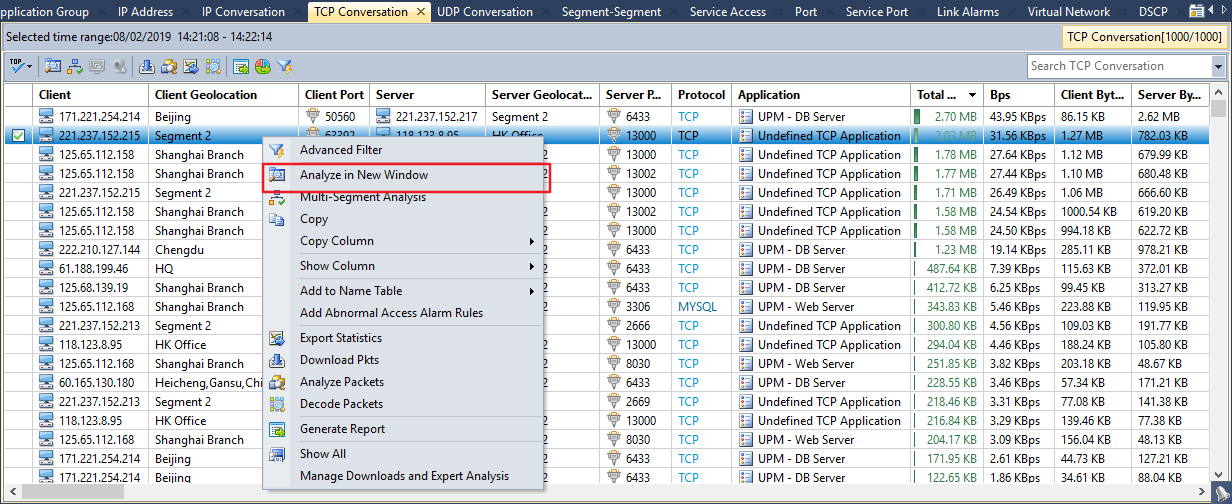
nChronos 5.6 provides a TCP conversations retrospective analysis feature to do retrospective analysis of selected TCP conversations.
In the TCP Conversations view, users can select one or multiple TCP conversations to do retrospective analysis. Select the conversations to be analyzed, and then click the  in the upper left corner of the view, so you can do TCP conversations retrospective analysis.
Data mining feature for transaction alarms
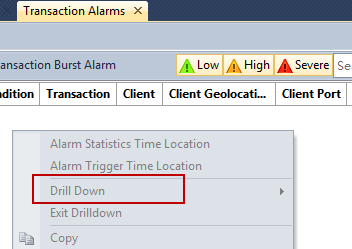
In the Transaction Alarms view, users can select the alarms to be drilled down, right-click, and select Drill Down in the menu to drill down the alarms.
By drilling down the alarms, users can get analysis statistics and transaction log information related the alarms.
Trigger dimension of traffic alarm configuration
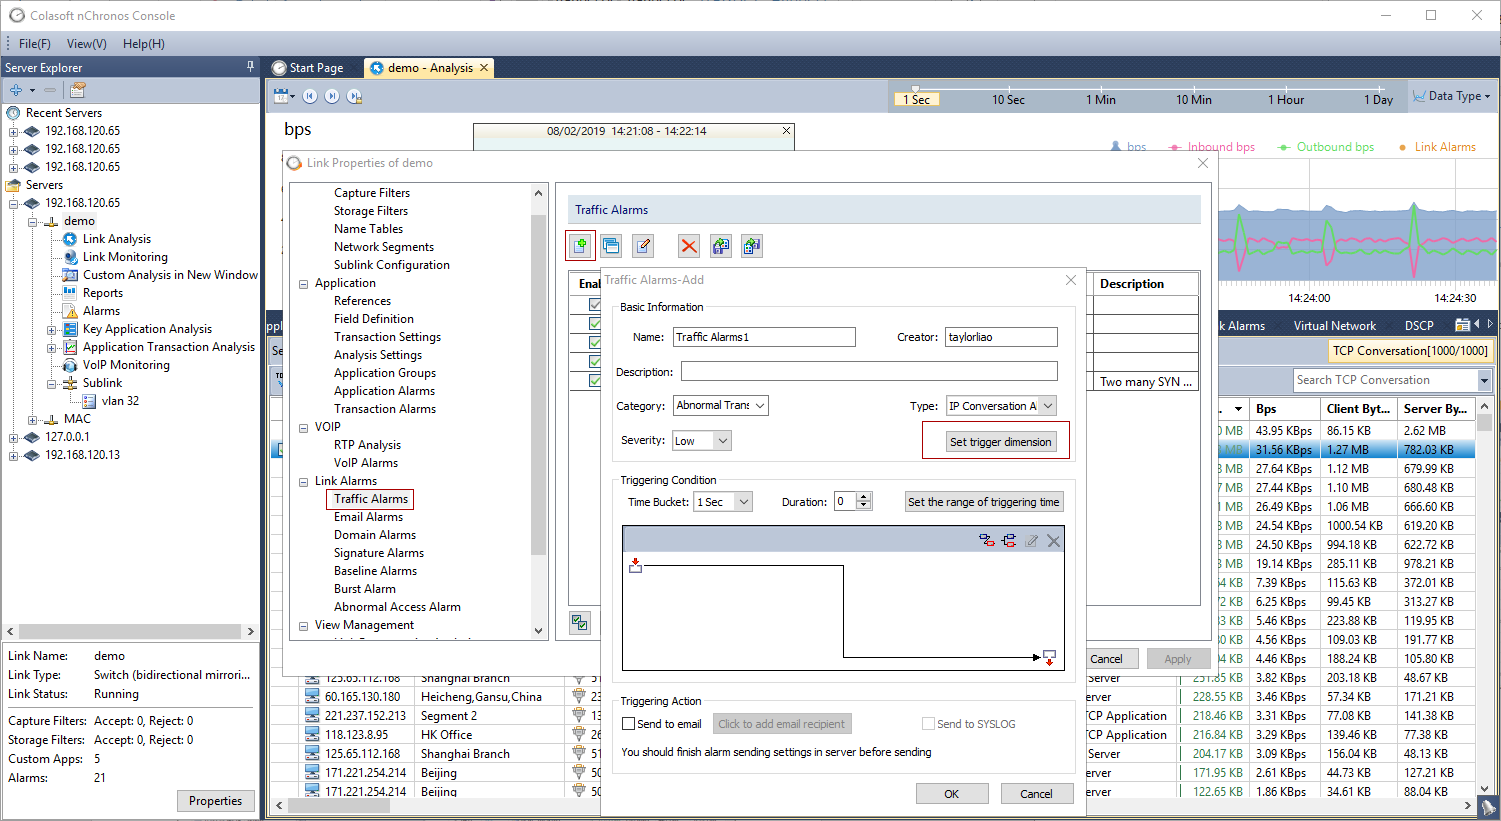
nChronos 5.6 provides the metric key value setting of traffic alarms. When adding a new alarm, users can set different trigger dimensions to get different results.
What's New in nChronos 5.4
VoIP analysis
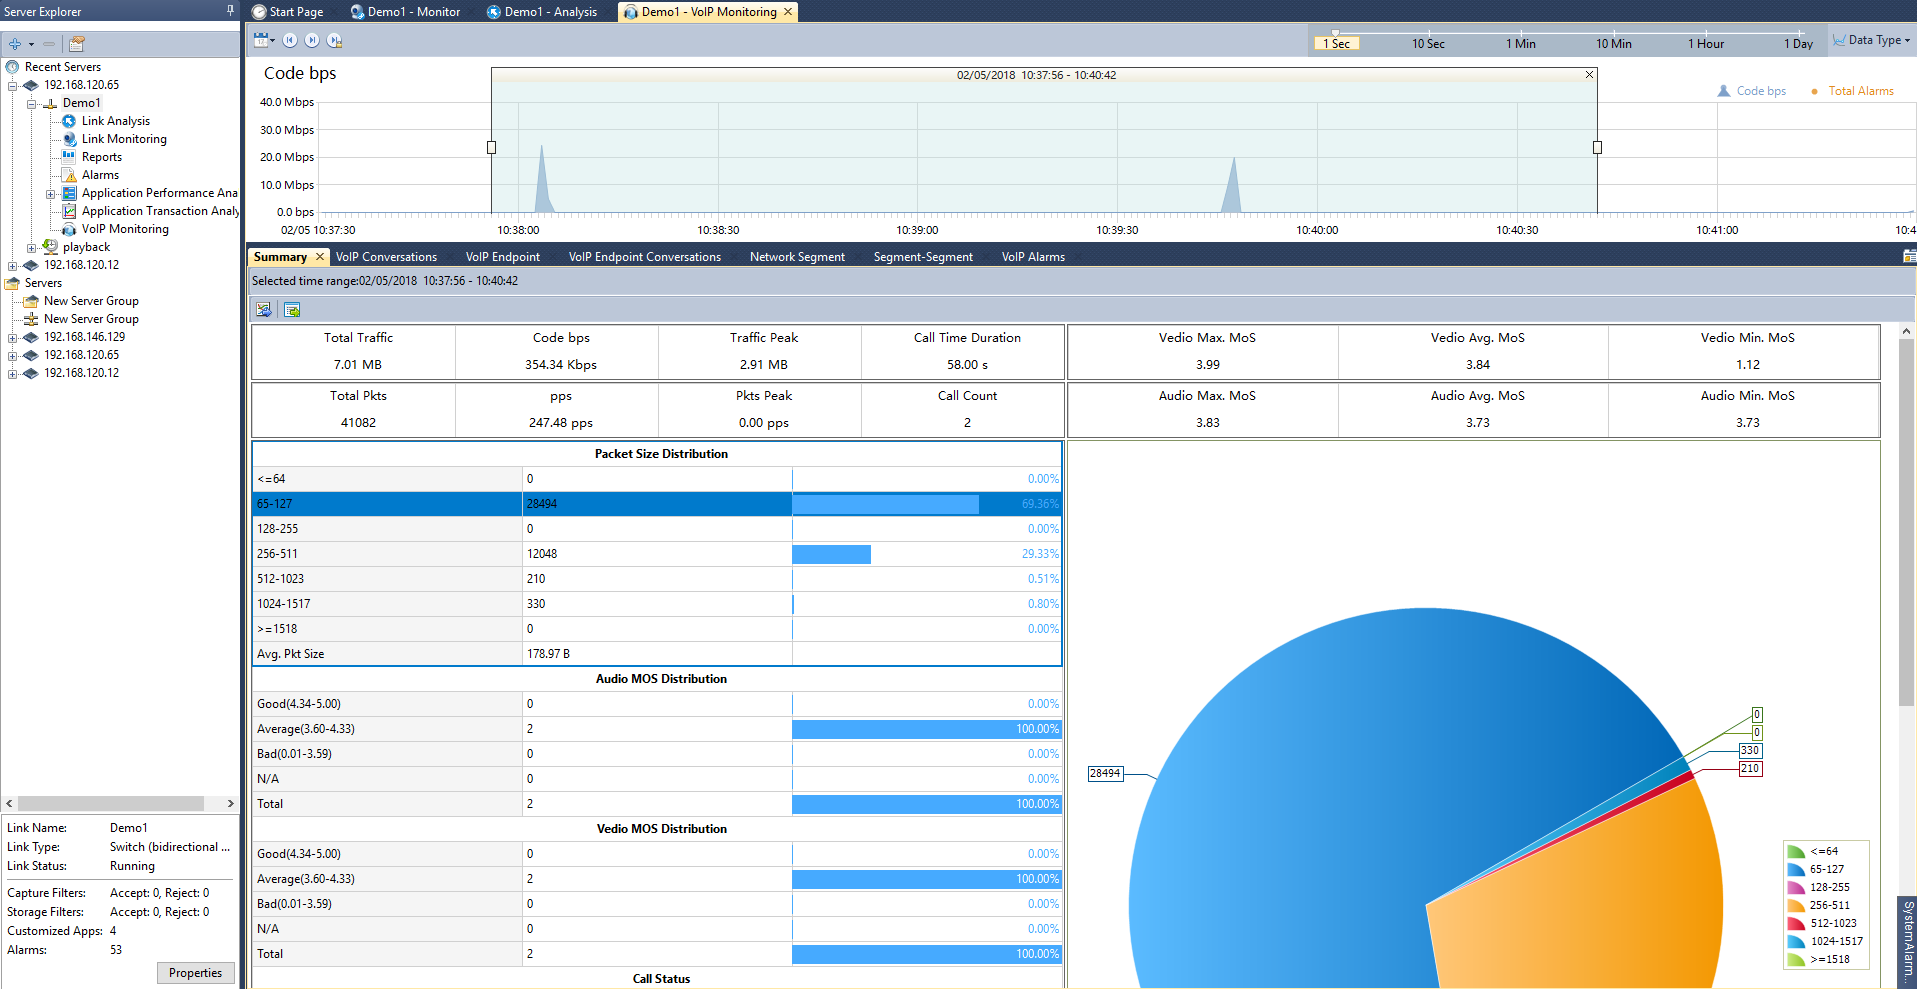
nChronos 5.4 provides a VoIP analysis feature to monitor and analyze VoIP traffic. In VoIP monitoring view, there are many tabs to display different metrics for VoIP analysis. The tabs include Summary, VoIP Conversation, VoIP Endpoint, VoIP Endpoint Conversation, Network Segment, Segment- Segment and VoIP Alarms.
In VoIP Conversation tab, users can view all the VoIP conversations. Double click the conversation to drill down for more information about this VoIP conversation. With metrics in these tabs, such as conversation delay, MOS, jitter, packet loss rate and etc., users can analyze the quality of VoIP conversations.
DNS transaction analysis
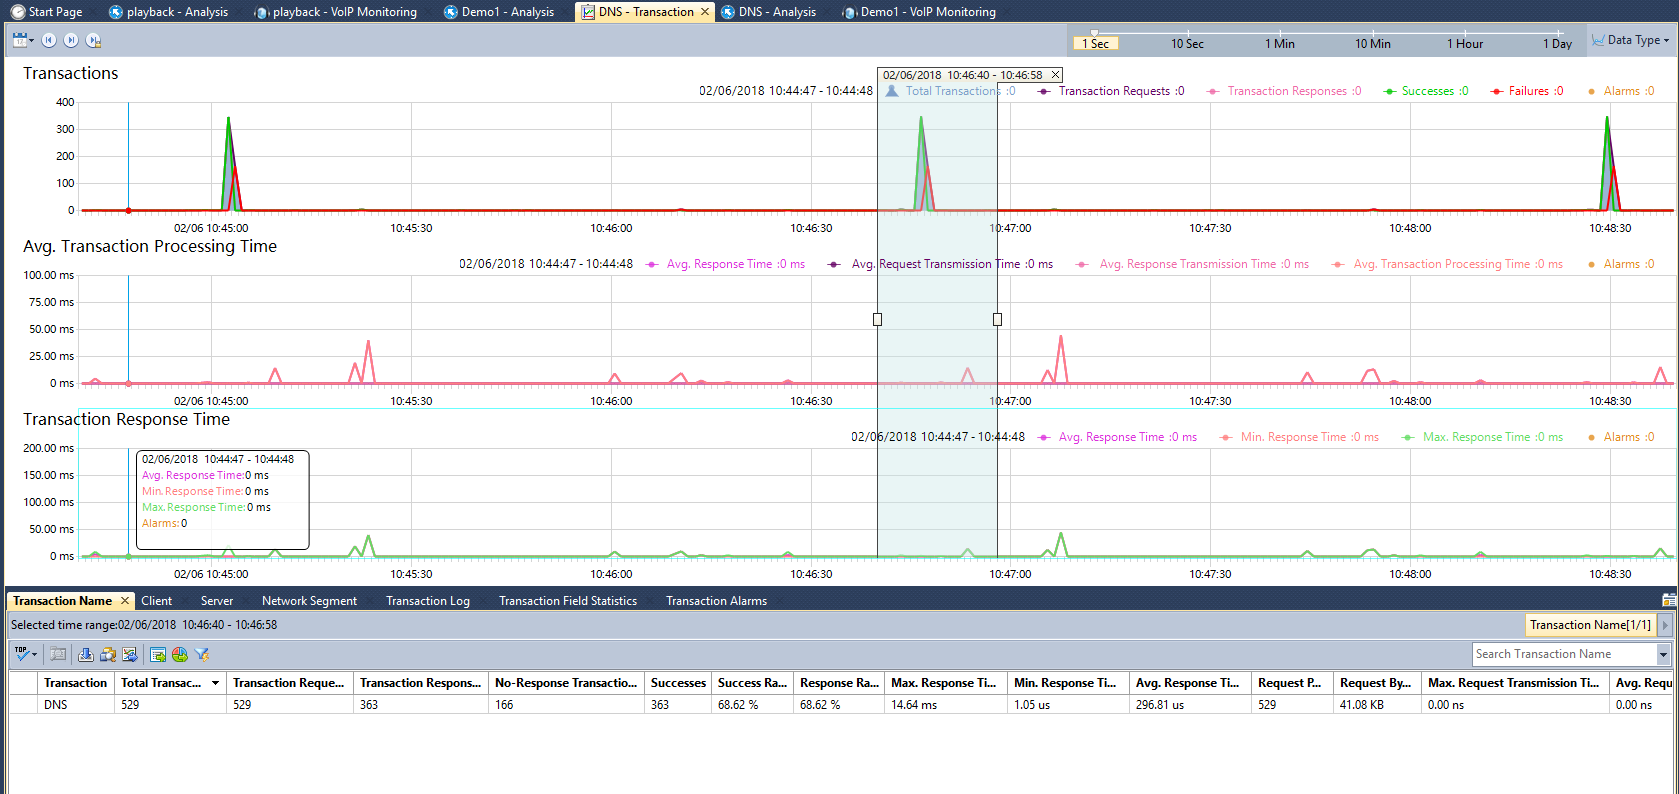
nChronos 5.4 provides transaction analysis based on DNS. Users don't need to define DNS transaction, because system builds in DNS transaction analysis, users can analyze request, responses, success rate, request rate, processing time and transmission time of DNS transactions, the related information on client side and on server side, transaction logs and transaction field statistics.
ICMP conversation delay analysis
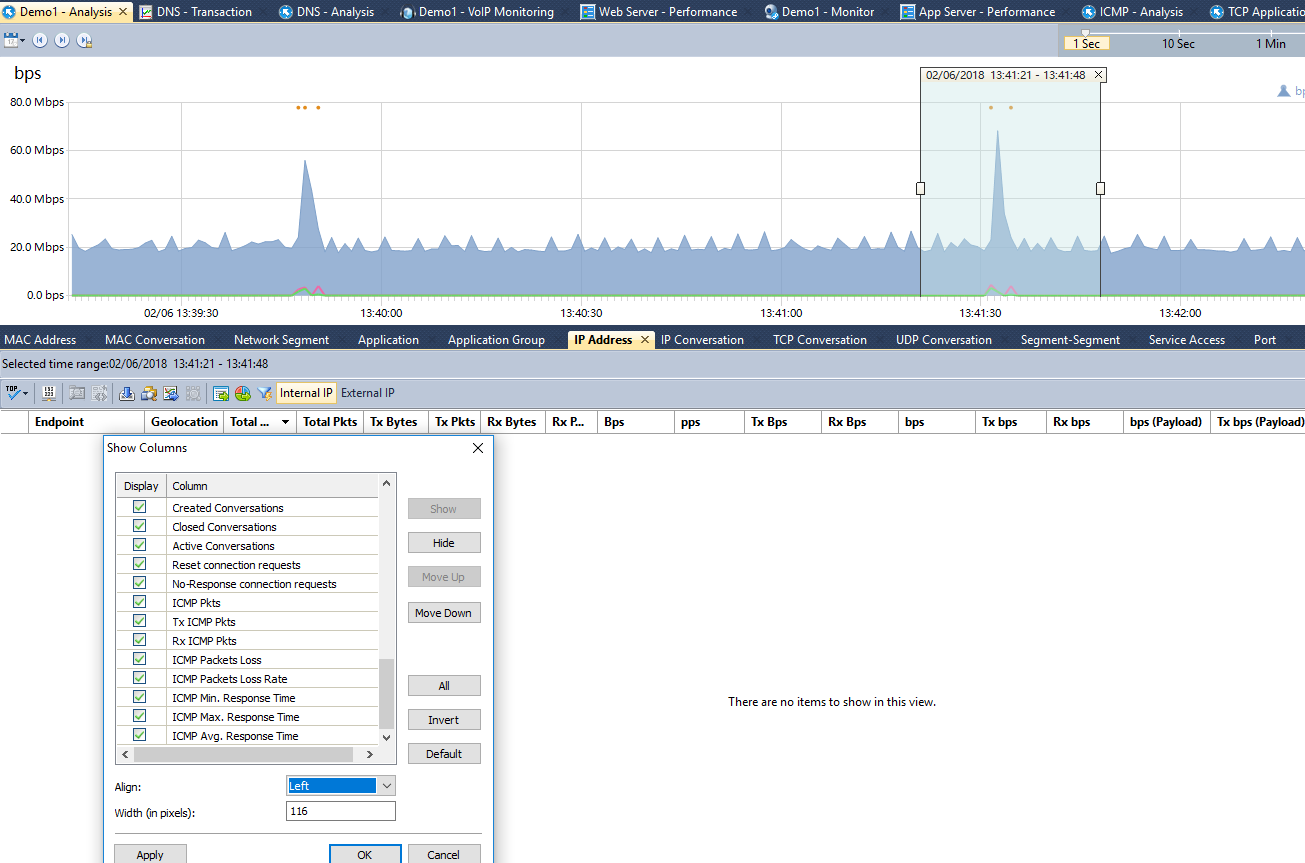
nChronos provides correlative metrics of ICMP conversation, which are used to analyze ICMP delay. In IP address, IP conversation, network segment, segment-segment, VLAN, VXLAN, MPLS VPN, DSCP tabs, users can view ICMP response time, ICMP packets loss rate and etc.
Link group
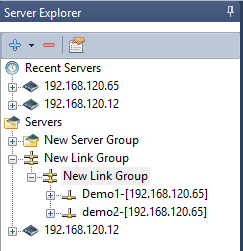
nChronos now supports the function of grouping links, users can group links according to various of dimensions, such as geolocation, department, business, etc. so as to monitor and analyze more conveniently.
What's New in nChronos 5.3
Server Status Monitor

nChronos 5.3 provides a Server Status page to display server status, including CPU, memory and storage usage. As for CPU and memory usage, a real-time chart is provided to display the usage information of latest 3 minutes. The highlight feature is that nChronos 5.3 displays the storage usage status, which shows customers current storage status, like if and when the storage space is full, how long it can store data before looping. The data types range from 1-second data, 10-second data to 1-day data, from raw packet to logs.
NetFlow Analysis
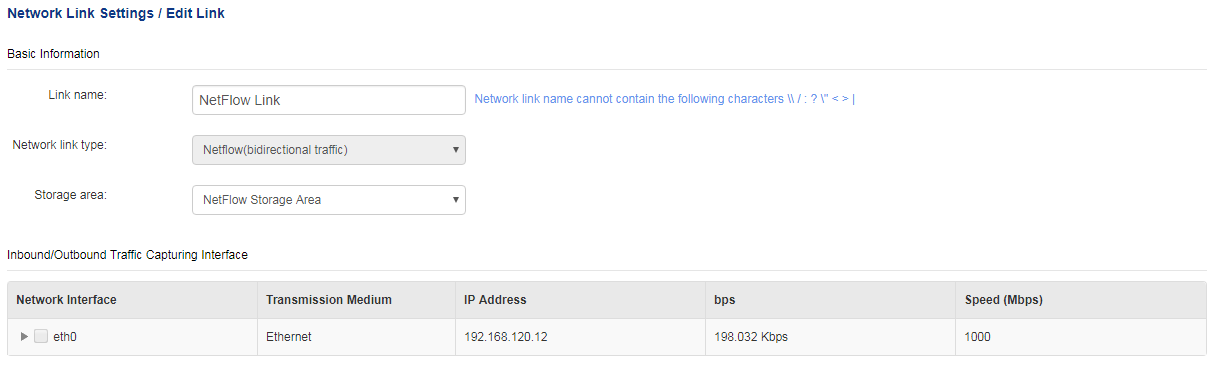
Colasoft provides NPMD (Network Performance Monitoring and Diagnostics) solutions based on packet sniffing technology.nChronos 5.3 provides a NetFlow analysis feature.
NetFlow, introduced by Cisco, provides the ability to collect and monitor IP network traffic. Besides packets-based technology, nChronos 5.3 supports NetFlow analysis to collect network traffic information, including summary statistics, network segments, applications, IP conversations, IP type of service information, etc.
Just as packet-based network links, for NetFlow links, users are still able to customize network segments, applications, alarms and reports, which help users monitor and analyze network anomalies more conveniently.
Agent Analysis
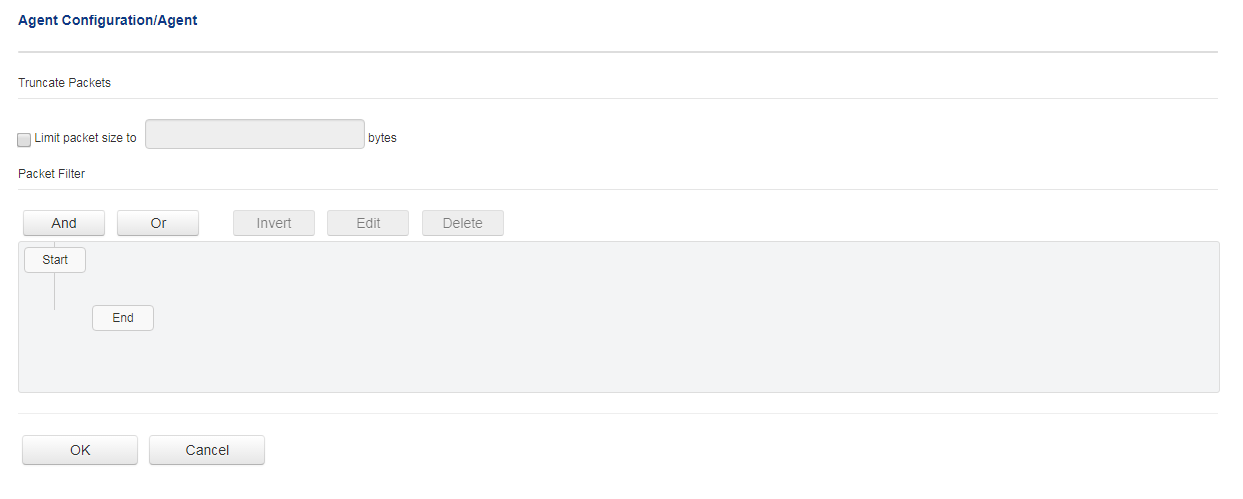
nChronos 5.3 provides a traffic forwarding Agent analysis feature. The traffic forwarding Agent is installed on a third-party server for forwarding the traffic from the server to the capture interface on nChronos Server.
With the Agent analysis feature, Colasoft supports collecting network traffic from virtual environment and cloud platform. Users can install Agents in virtual environment and forwards the traffic of the virtual environment to nChronos Server for analysis. An Agent link is provided to make filter rules, define network segments, and customize applications and alarms. With cloud probes, it becomes feasible to monitor and analyze cloud-based applications performance.
UDP Conversation Multi-segment Analysis
With earlier versions nChronos provides Multi-Segment Analysis function for TCP conversations. With nChronos 5.3, users are able to do multi-segment analysis for UDP conversations.
Multi-Segment Analysis associates and correlates the data of the same conversation collected on two or more network segments. From the result of the analysis, users can get some information about the conversations, like packet loss, delay, retransmission, etc.
nChronos 5.3 improves Multi-Segment Analysis feature by providing TCP transaction list for TCP conversations, and by supporting load-balance conversation correlation analysis.
Oracle Transaction Analysis and XML Transaction Analysis
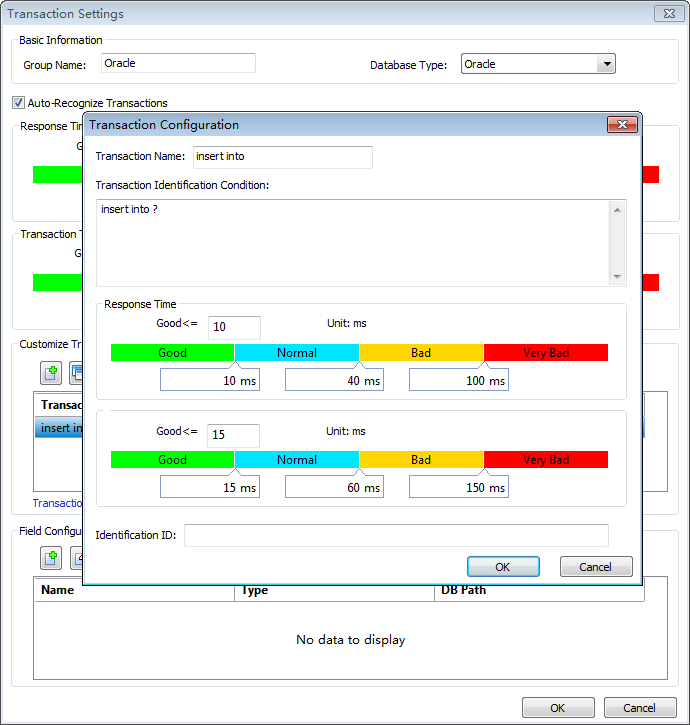
nChronos 5.3 provides transaction definition and analysis based on database. Transactions based on Oracle or DB2 database can be analyzed. A transaction analysis window is provided to display the details of all transactions, including transaction name, traffic information, success rate, response time, the related information on client side and on server side, transaction logs and transaction content. Furthermore, users are able to define transactions based on xml.
What's New in nChronos 5.2
Baseline Analysis
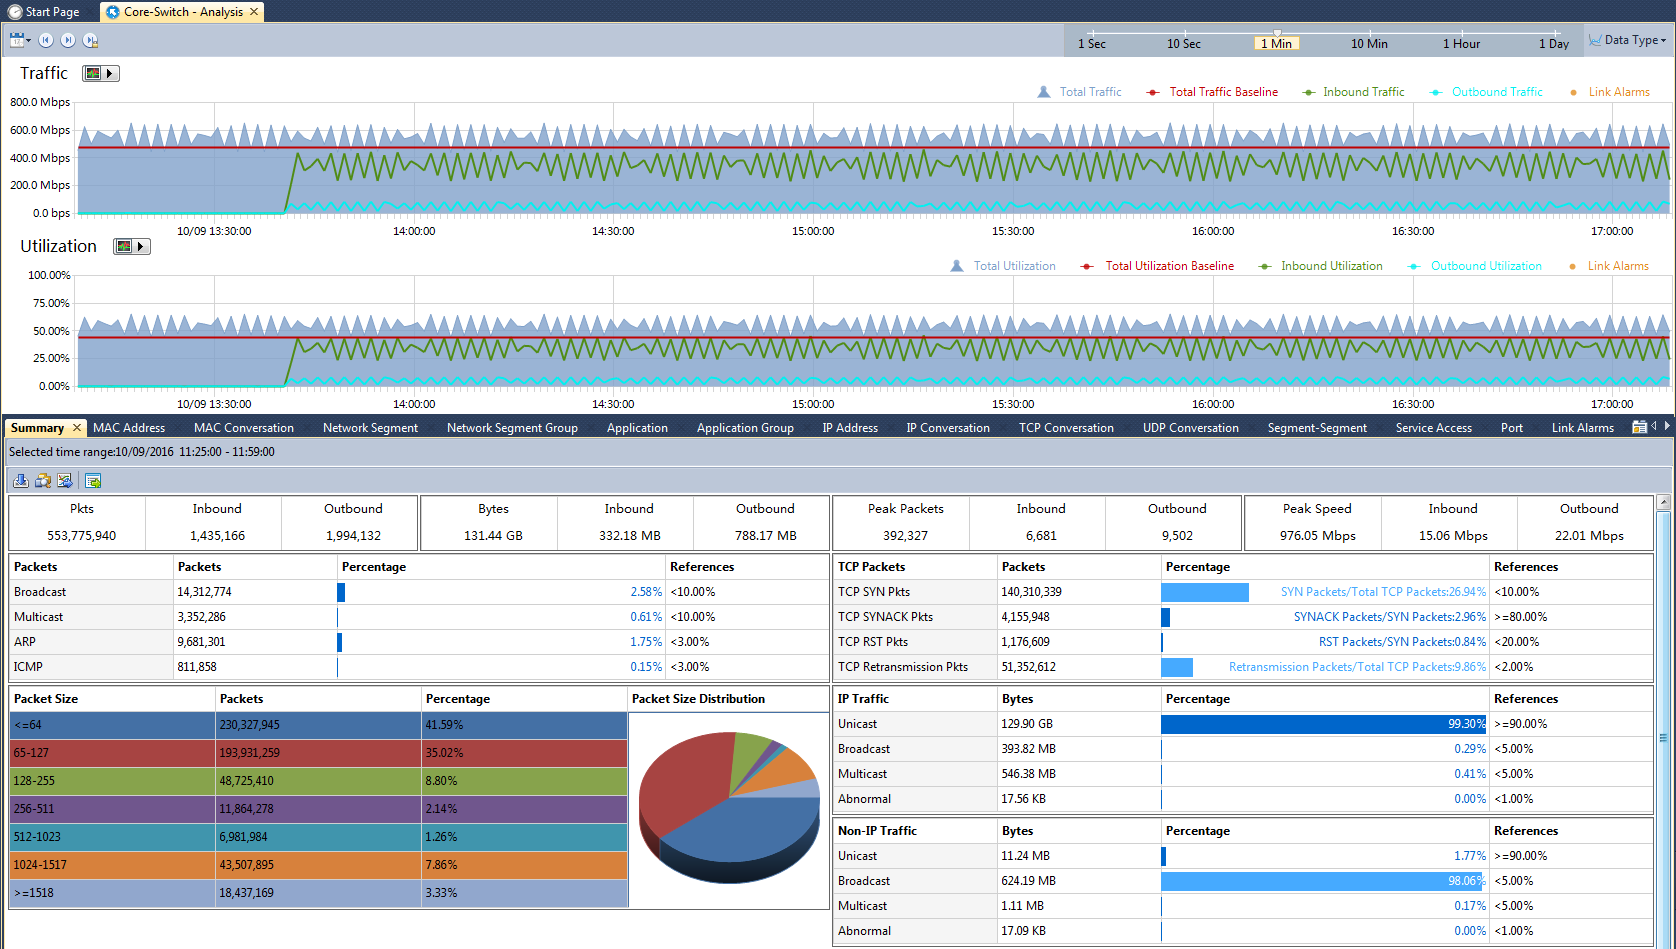
nChronos 5.2 provides a baseline analysis feature. On nChronos trend charts, choose a baseline type, and then the baseline will be automatically generated and displayed. The trend charts could be based on traffic, bandwidth utilization, packets and broadcast packets.
And, nChronos 5.2 provides baseline alarms. User can define baseline alarms by setting a deviation threshold from the baseline. When the baseline value matches the threshold condition, the baseline alarm will be triggered and displayed on alarm window. With baseline analysis, it is easy for network administrators to compare current network traffic with historical network traffic, and thereby find out network abnormalities.
Whitelist/Blacklist Alarm
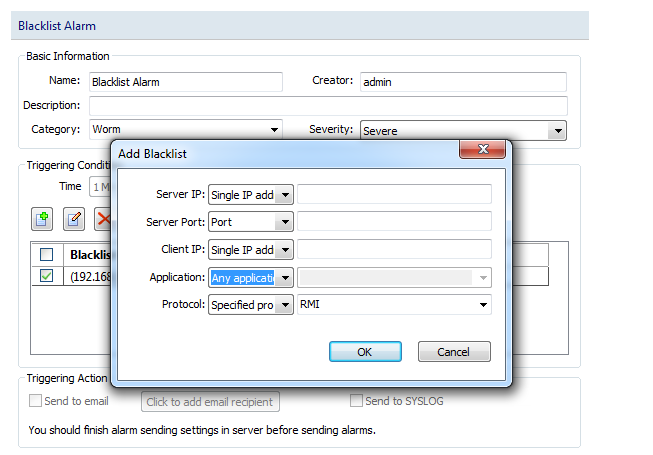
nChronos 5.2 provides a whitelist alarm and a blacklist alarm. Both whitelist and blacklist are defined based on server IP, server port number, client IP, application and protocol. When any captured conversations match the blacklist or don't match the whitelist, the blacklist alarm or the whitelist alarm will be triggered. With whitelist and blacklist alarms, it is efficient to find out abnormal network accesses.
TCP Transaction Analysis
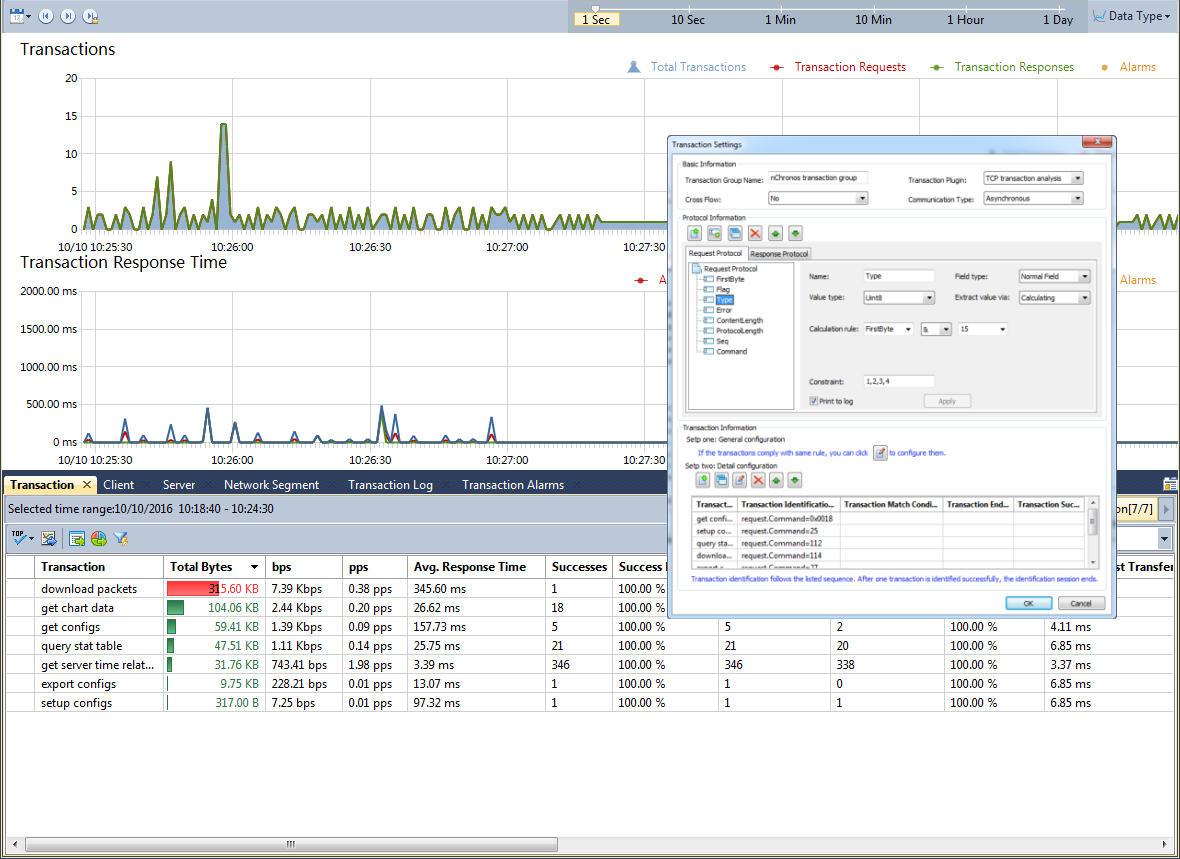
nChronos earlier versions provide transaction analysis based on HTTP protocol. With nChronos, TCP-based transactions can be analyzed. nChronos provides a transaction analysis window to display the details of all transactions, including transaction name, traffic information, success rate, response time, the related information on client side and on server side, transaction logs and transaction content.
Users can define TCP transactions based on the protocol fields of application layer according to actual network applications. nChronos is capable of monitoring transaction performance and recording transaction content, which provides reference value for business analysis and application performance analysis.
Network Segment Group Analysis and Application Group Analysis
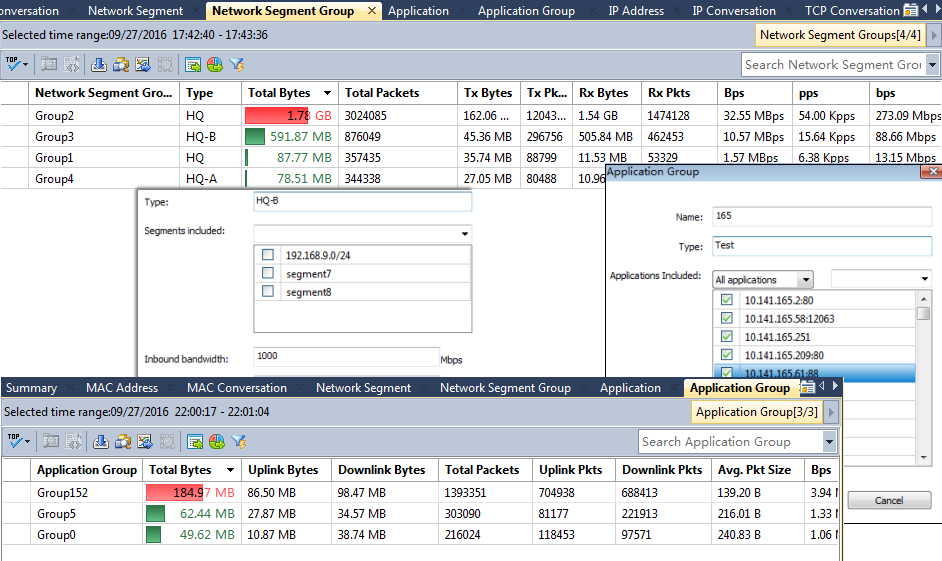
With network segment group analysis, nChronos is able to group multiple network segments and do traffic statistics based on the groups. With application group analysis, multiple applications can be grouped as one type and nChronos can do application traffic statistics based on the application group. A Network Segment Group view and an Application Group view are added to display the statistics.
For example, for a WAN access network link of a bank, users can use the network segment group feature to do traffic statistics for branches and sub-branches.
What's New in nChronos 5
HTTP Packet Reconstruction
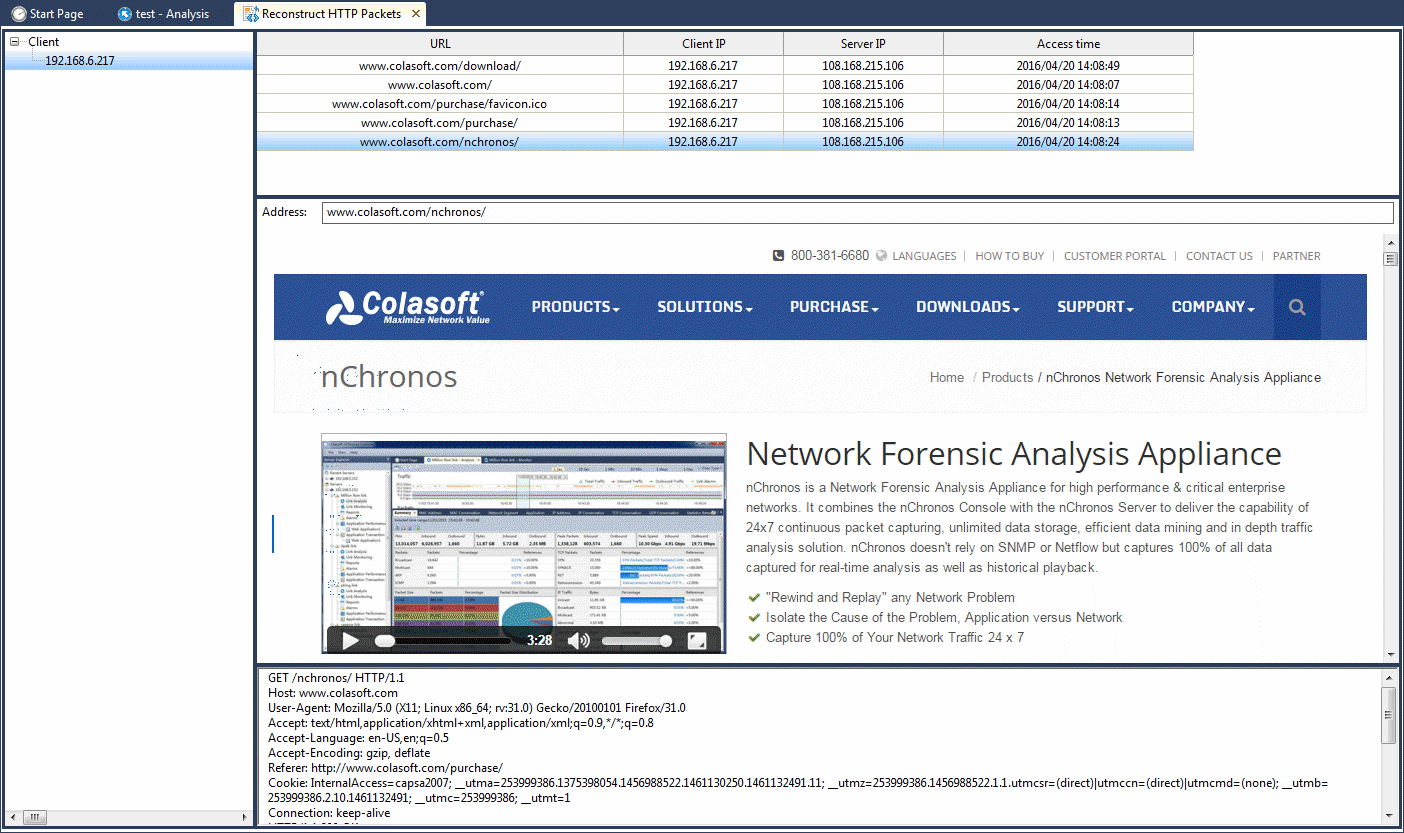
Colasoft nChronos 5 provides an HTTP packets reconstruction functionality, which is capable of reconstructing a complete webpage that an endpoint visits. Simply select the time range that you are interested in, select an IP address and click "Reconstruct HTTP Packets", then nChronos shows the web pages that the IP visit during that time range, including URL, client and server IP, and access time. Click a desired URL, the window shows the related page and original codes. You can also select the application "Web" and right-click "Reconstruct HTTP Packets", and then all pages visited in that time range will be displayed.
Packet Replay Link
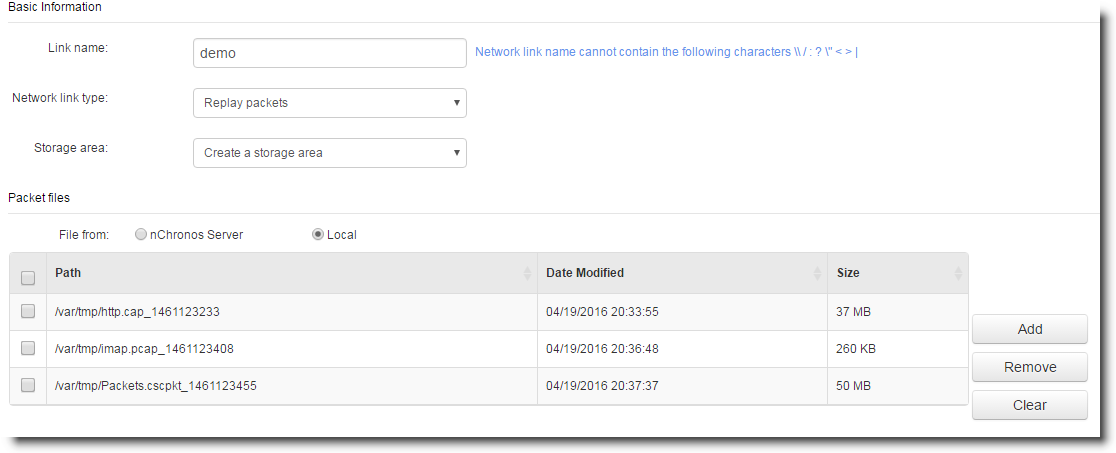
Colasoft nChronos 5 provides packet replay link, with which you can set up analysis rules to analyze packet files. The replay link has exact the same function as a normal capture link, including bandwidth settings, alarms, name tables, segment settings, etc. The packet file can be trace files from nChronos Server or from local folders saved by other programs, such as Colasoft Capsa and Wireshark.
Quick Decode with Expert Analyzer
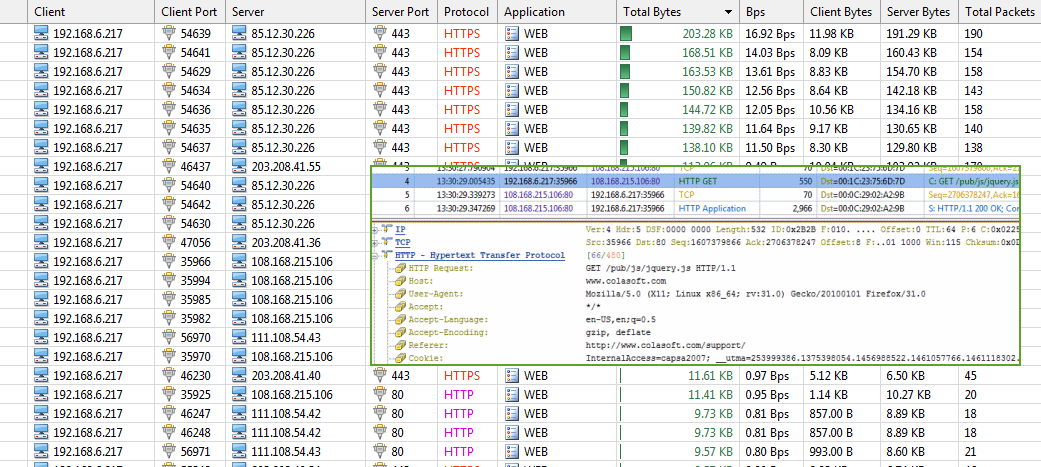
Sometimes we need to see the proof details to define the root cause when there is abnormality on the network, especially when we need to define the problem which is related to network or to application. With nChronos 5, you can view the packet details very quickly, without opening the complete Expert analyzer. Just select the interested traffic and click "Decode Packets", you can load Expert Analyzer to decode packets down to protocol fields.
VXLAN Analysis
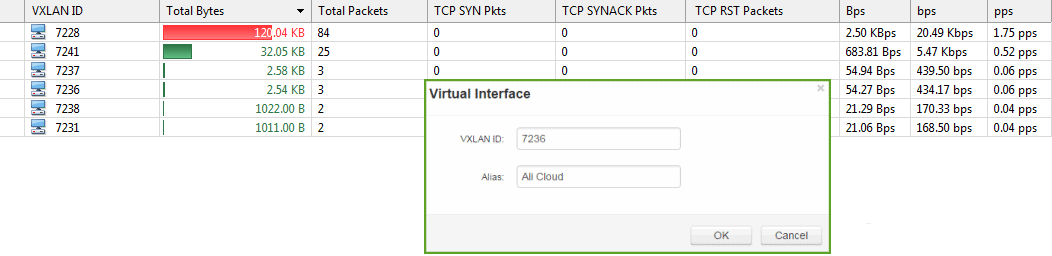
Colasoft nChronos 5 supports VXLAN analysis. Users can define virtual interfaces based on VXLAN ID. The data from different VXLAN channels can be analyzed as from a network link. A VXLAN view is provided to display VXLAN statistics, including VXLAN ID, traffic information, TCP packet data, etc. Users can drill a VXLAN item down to application and IP address.
Convert Statistics to Graph

Colasoft nChronos provides lots of statistics, which are displayed on the statistical views. Now, you can convert the statistics to a graph by some clicks. Just click the Generate Graph icon on the toolbar, all the data are displayed in a top chart. You can modify top number and sample field for the chart. You can show the chart as pie chart or column chart, and you can save the chart to local. To convert the chart back to statistics, just click the button again.
WYSIWYG Report from Statistical View

With earlier versions, to generate a report, you need to go to the Reports window and to choose the desired report modules. But now, with nChronos 5, you can generate a WYSIWYG report. The data on all statistical views can be generated as reports. To have a WYSIWYG report, just click the Generate Report icon on the toolbar and choose the interested fields. For WYSIWYG reports, you still can set the report time, compare the report data with historical data, and send the report to any email recipients.
Statistics between Network Segments
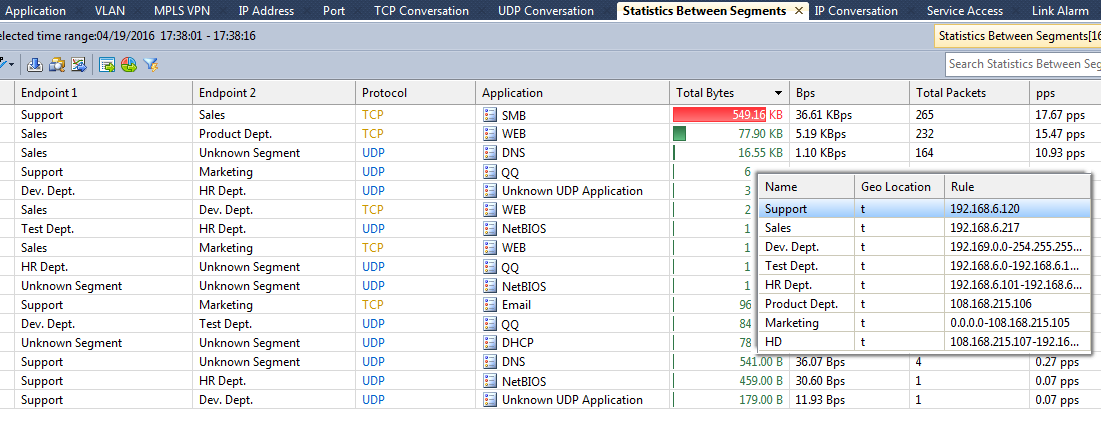
Networks contain various subnets. Usually we call a subnet as a network segment. With nChronos, you can define a network segment based on an IP, several IPs, or a subnet. The communication traffic between those network segments can be calculated. Colasoft nChronos 5 provides a Statistics Between Segments view to display the communication between two segments. With that view, just by a glance you can know which applications and protocols are running between segments. You can furthermore drill the communication down to IP conversation and TCP conversation.
Advanced Filter View
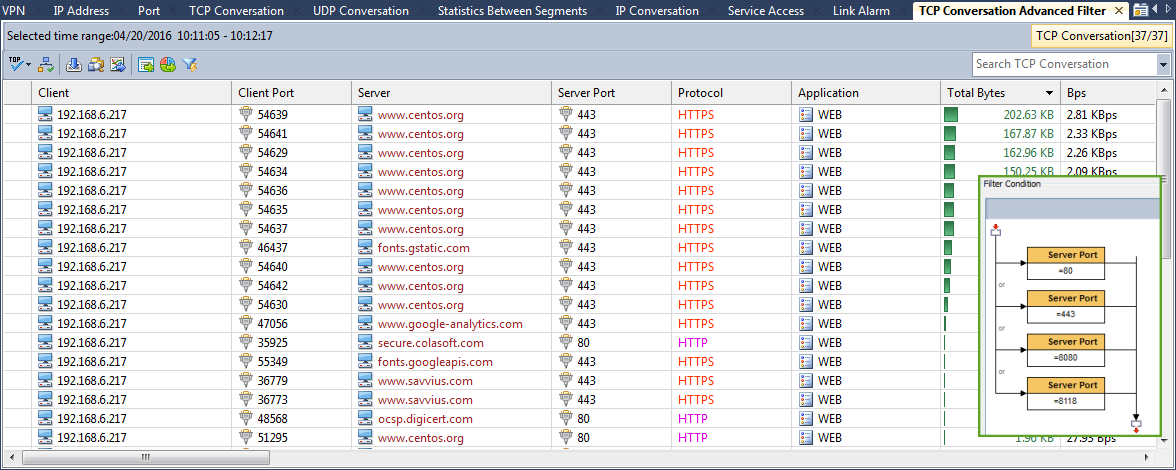
With numerous data on the statistical views, it is not easy to see the one that you are interested in. Colasoft nChronos 5 provides an advanced filter, which enables you to generate a new view based on the existing view via logically combining lots of filter conditions. The newly generated filter view provides all the functions that the original view provides, including drilldown, analyzing with Expert Analyzer, generating graph, generating report, downloading packets, etc. You can even generate another filter view based on the existing filter view. The generated filter views will be auto-saved on nChronos Console when you close Console.
What's New in nChronos 4.3
Service Port Monitor
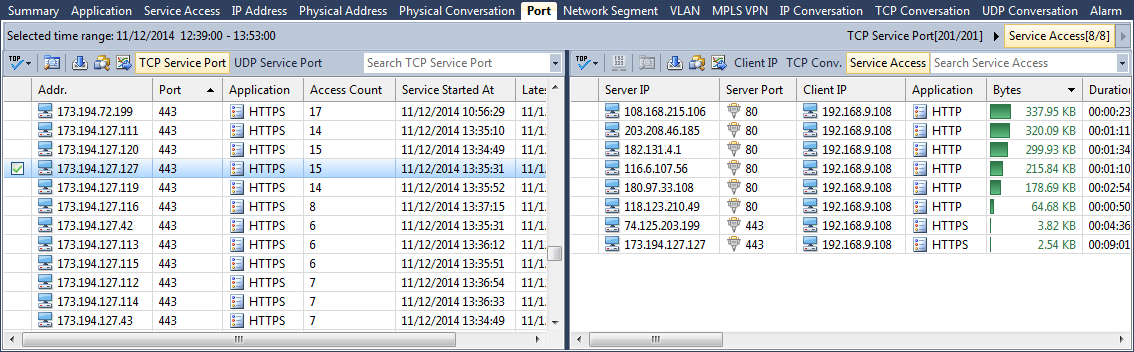
nChronos 4.3 provides a Port view and a Service Access view to monitor and analyze service ports. The Port view calculates the statistics based on IP address + TCP/UDP service port. Together with the sorting function of nChronos, you can easily know which service ports are running on the network, and running for which IPs. The Port view further provides other information about the service port, including the application, the uplink and downlink traffic, the service access time, access times, etc. The Service Access view calculates the statistics based on server and client IPs, port number and applications. It provides the access details for each service port. You can drill a service port down to a specific service access session.
VLAN and VPN Virtual Link Support
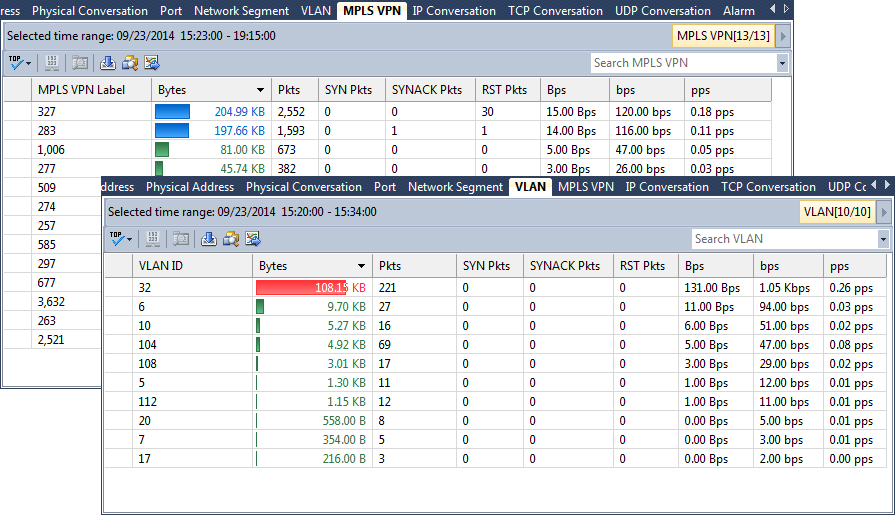
nChronos 4.3 provides support for virtual links, including VLAN and MPLS VPN. You can add virtual interfaces and set up network links based on the virtual interfaces. There is a VLAN view, which displays traffic statistics based on VLAN ID. An MPLS VPN view is also provided to display traffic statistics based on MPLS VPN label. Together with the name table function of nChronos, you can add names for VLANs and MPLS VPNs.
Millisecond Analysis
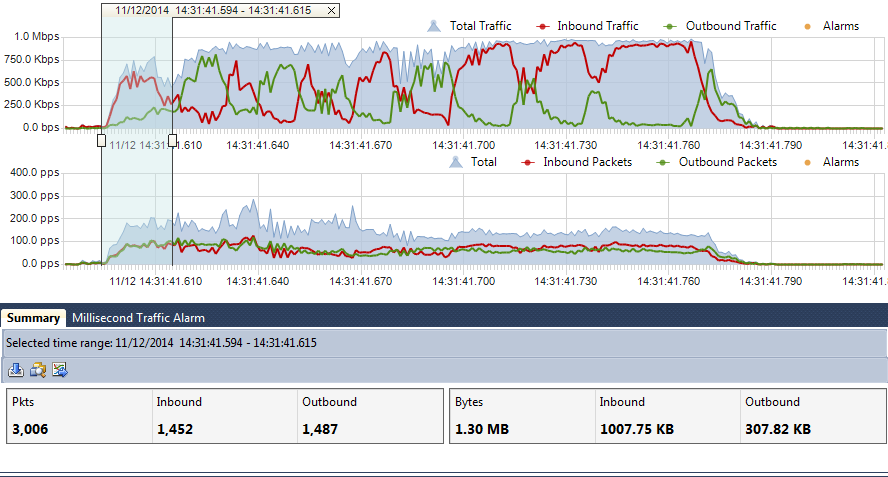
Millisecond analysis provides traffic analysis accurate to one millisecond. It is important for users who care about transient traffic burst. Colasoft nChronos 4.3 provides millisecond traffic statistics and millisecond traffic alarm. Users can define any millisecond traffic alarm according to the need. The Millisecond Analysis window displays the millisecond traffic statistics trend charts in real-time.
Multi-Segment Analysis
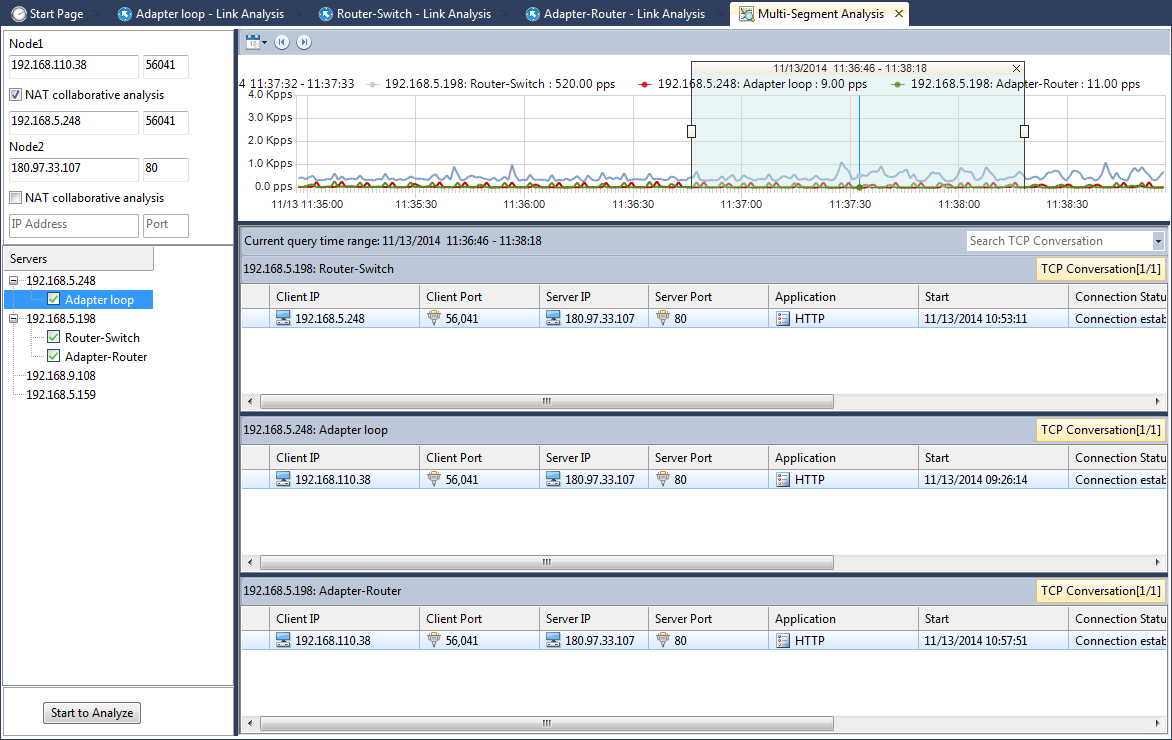
Sometimes the responses from large websites are very slow, and to find out the system bottleneck for the websites, it is necessary to analyze each link of the websites. Colasoft nChronos 4.3 provides a multi-segment analysis function, which associates and correlates the data of the same conversation collected on two or more network segments, and displays graphical performance analysis results, like packet loss, delay, retransmission, etc., thus providing visibility into the areas where bottlenecks may occur. A Multi-Segment Analysis window has a timeline pane to show the traffic trends of monitored links. When a conversation is analyzed, the conversations on other segments will be picked up and analyzed automatically.
A Multi-Segment Detail Analysis window shows the detailed analysis results and visualizes the conversation flow across multiple segments. When clicking and hovering a packet, correlated packets will be highlighted, the time difference between the packets will be displayed, and the packet view will show the in-depth decoding information for that packet.
Storage Filter
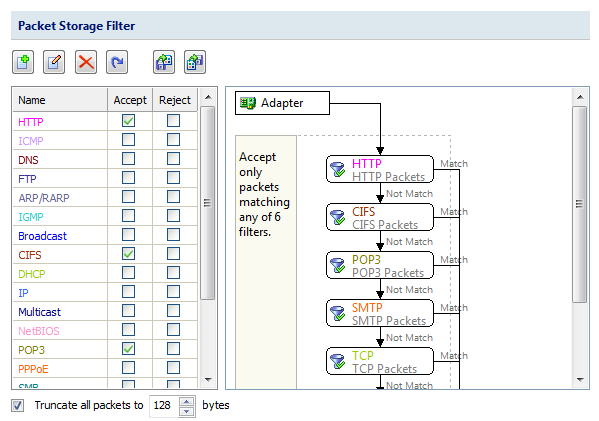
nChronos 4.3 provides Storage Filter for users to store packets that match the filer rules. You can define the filter rules based on IP/MAC address, port number, protocol type, packet size, etc., and only packets matching the rules will be stored. Besides the filter rules, Storage Filter provides a functionality to truncate the stored packet to a specified size. With Storage Filter, you can store interested packets, and even store only the first few bytes of interested packets. It saves storage space, and helps you avoid from policy problems in some environment.