Colasoft UPM
Unified Performance Management Platform
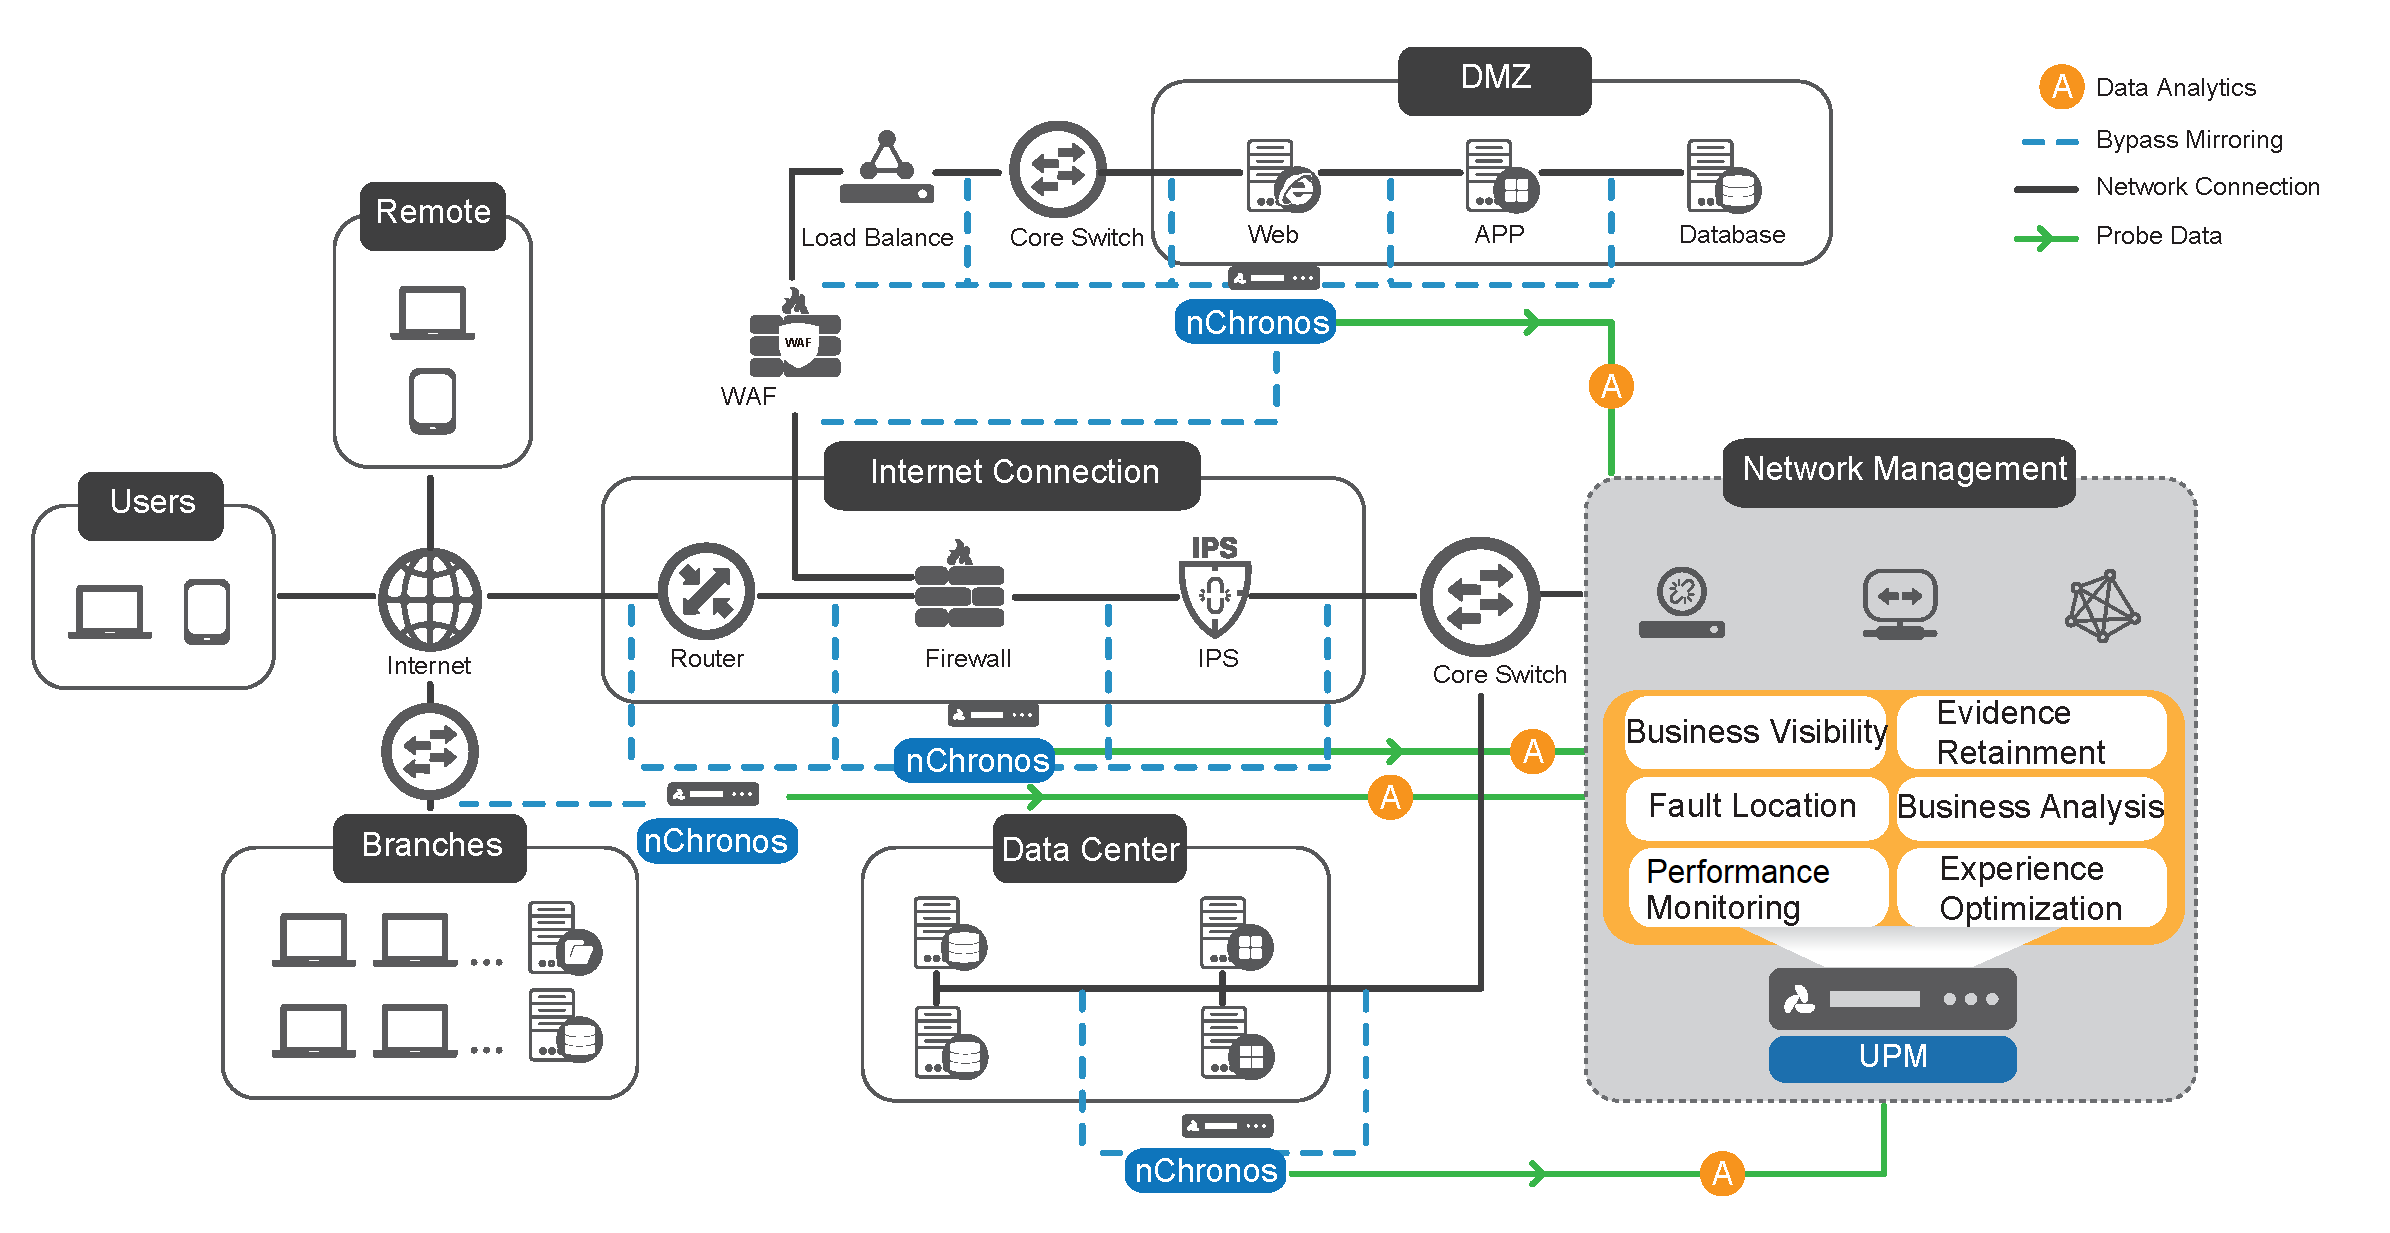
Colasoft Unified Performance Management (UPM) platform is a business-oriented network performance management solution. It is capable of monitoring service quality of all respects of a business network and quickly detecting and pinpointing problems affecting performance and stability of key business.
Colasoft UPM aims to maximize business network management efficiency and network fault troubleshooting capability by providing business-centered network supporting environment review, real-time performance monitoring and quick detecting of network fault. Colasoft UPM collects all real-time analysis data from Colasoft nChronos which are deployed distributedly at each network node and provides operations staff with vivid and graphic working status of every node in the business network.
Benefits
Ensure Application and Business Availability
Visibility into application access relationship (automatic generation), topology integration and operation quality monitoring, to ensure network availability.
Comb Business and Know Business Health
Combing mixed business for business-oriented performance monitoring, view colored (red/yellow/green) status on dashboard to know the health of each business.
Reduce Time of Troubleshooting Network Faults
Evaluating the effect of each application which supports business system and network performance degradation to business, quickly pinpoint and locate the source of the problem.
Visualized Business Running Status
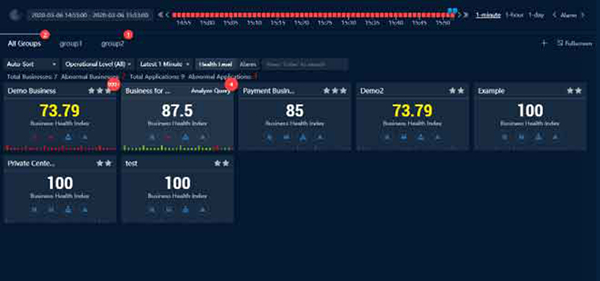
Show visual overall running status of businesses, and enable operators track the quality of each business.
Comprehensive Application Metric
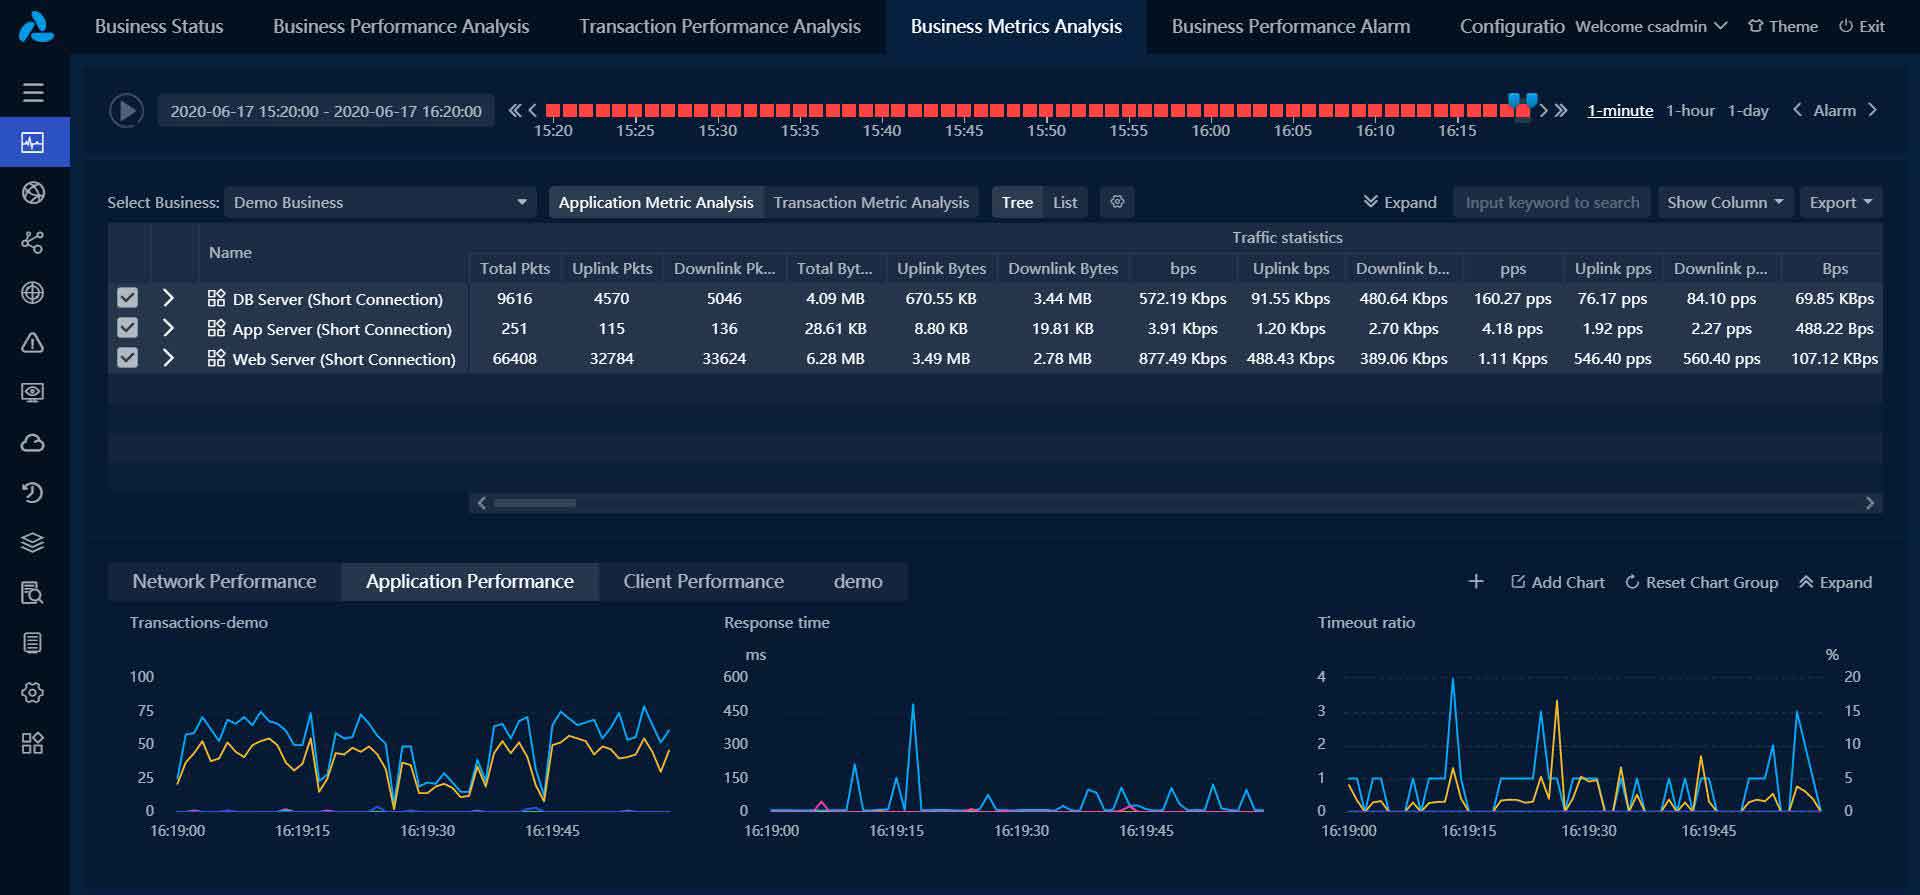
100+ metrics with abundant graphs provided for business and application analysis.
Network Monitoring and Analysis
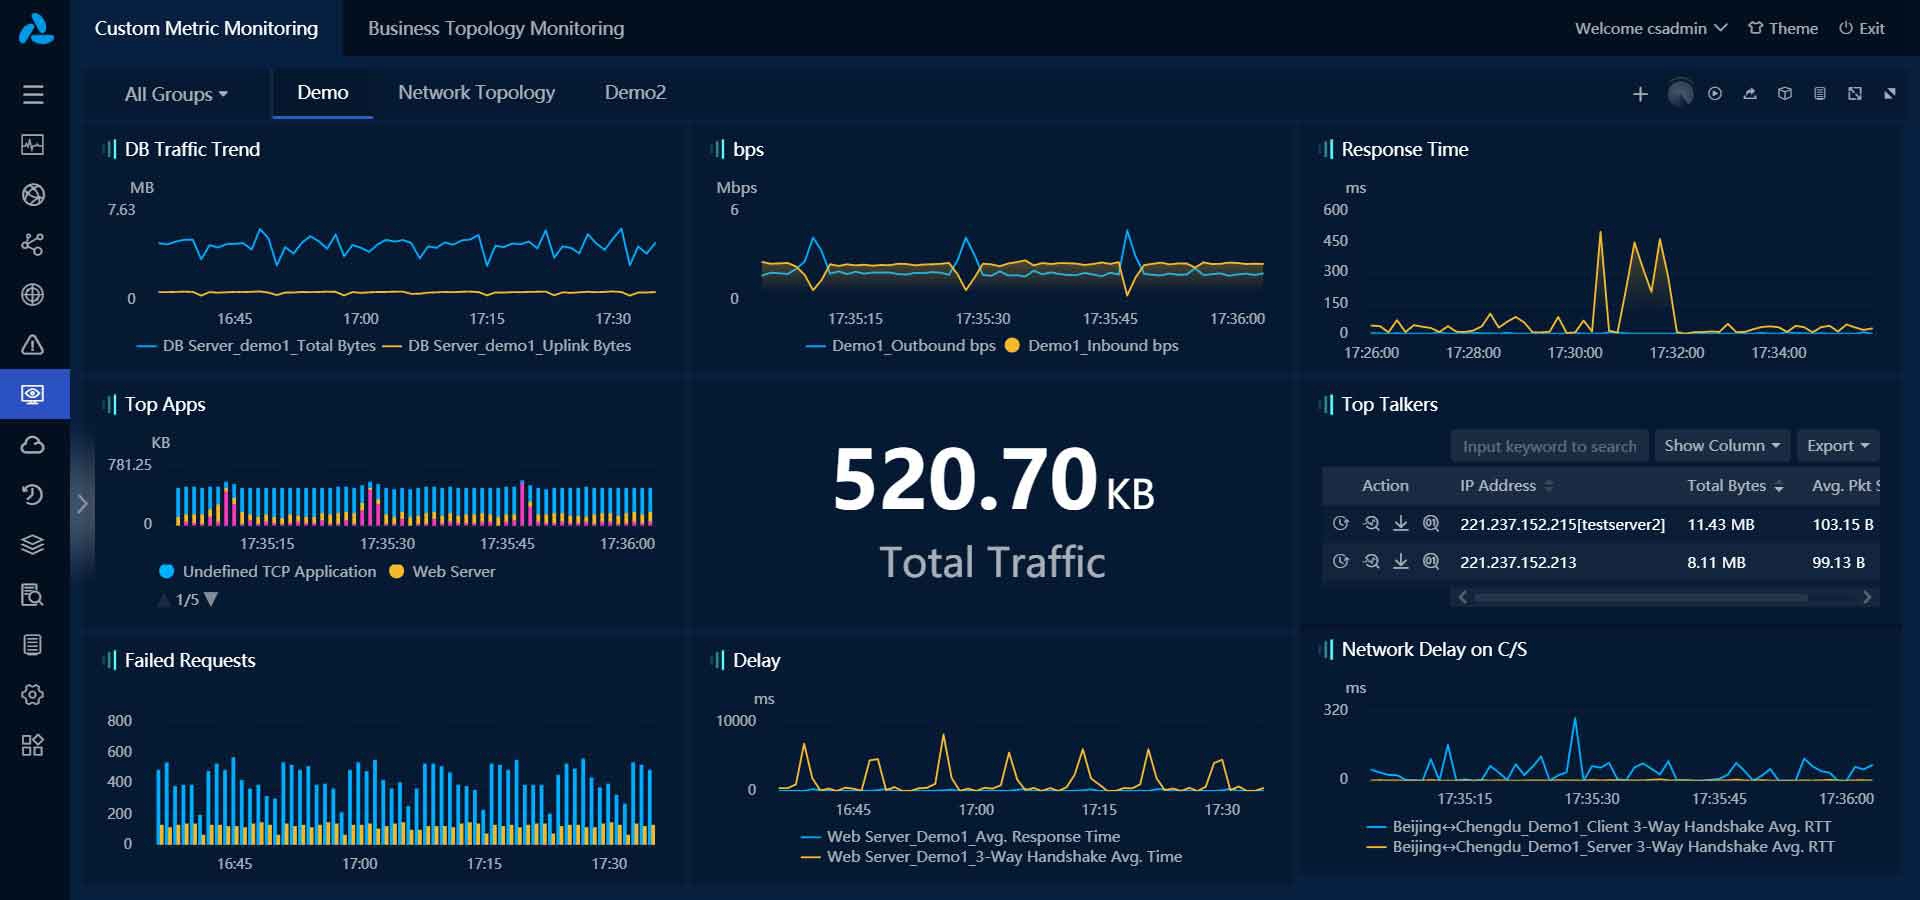
Customizing metrics for network monitoring to clearly know network status.
Real-time Alarms
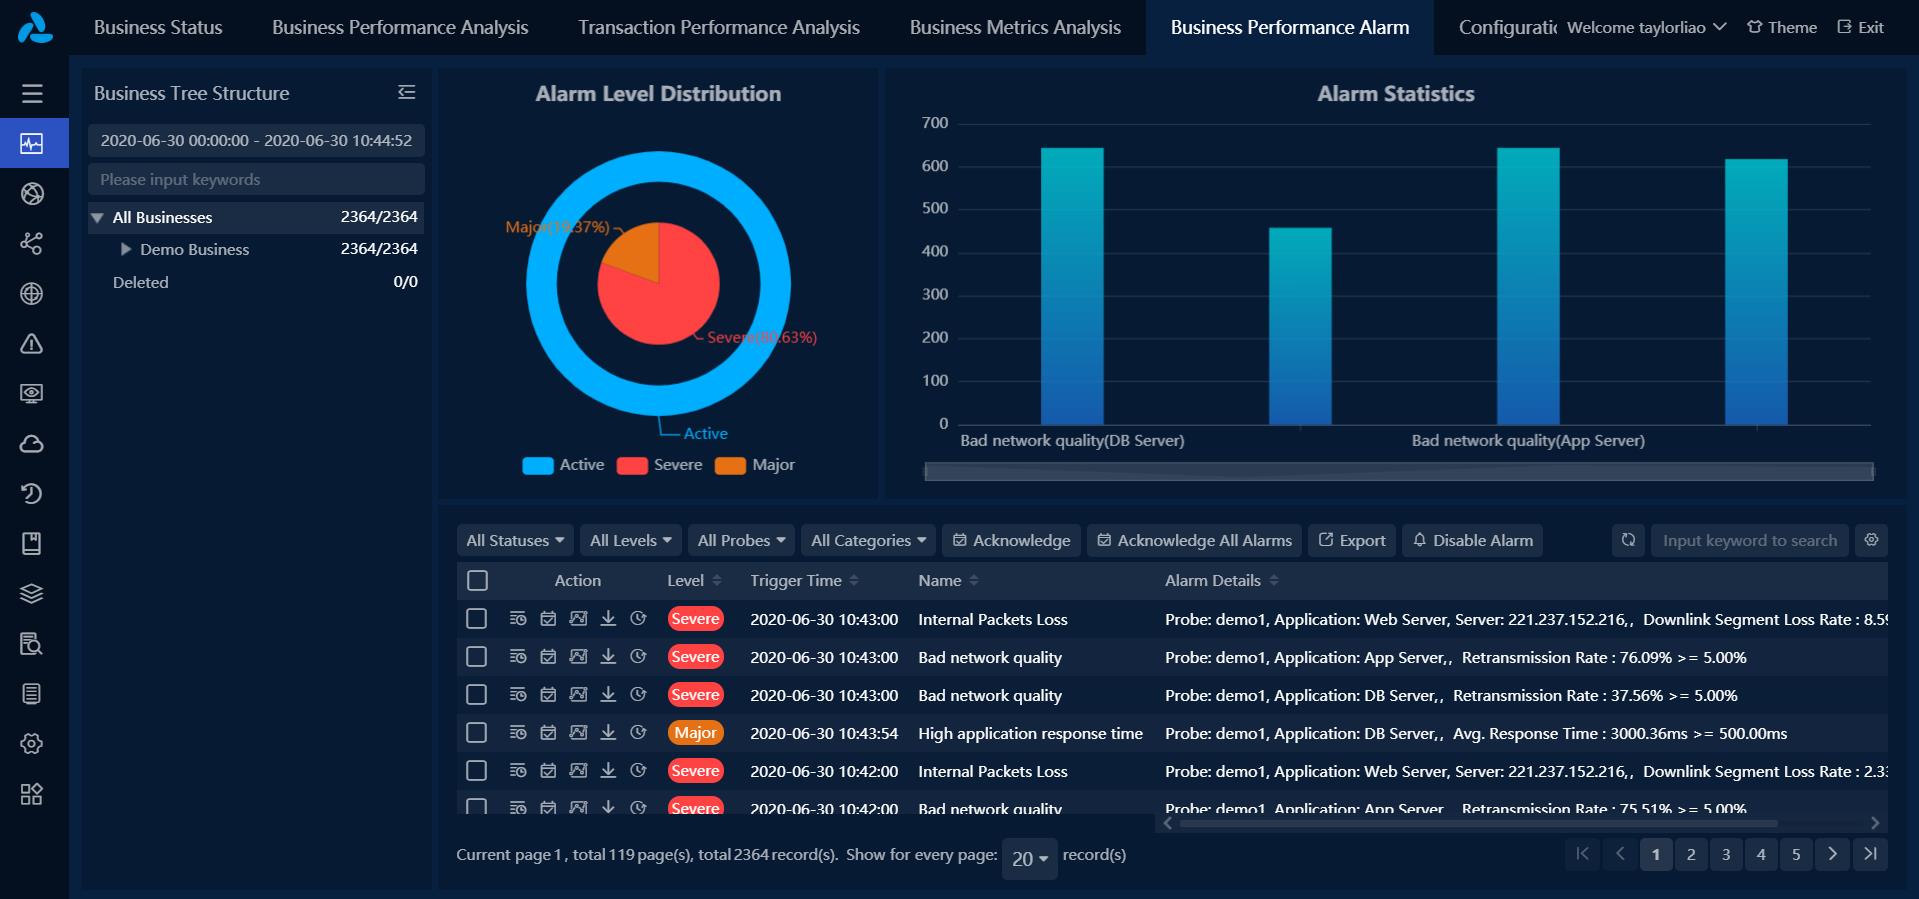
Default and customized alarms for businesses, applications and links.
Quick Analysis of Business Performance Problem
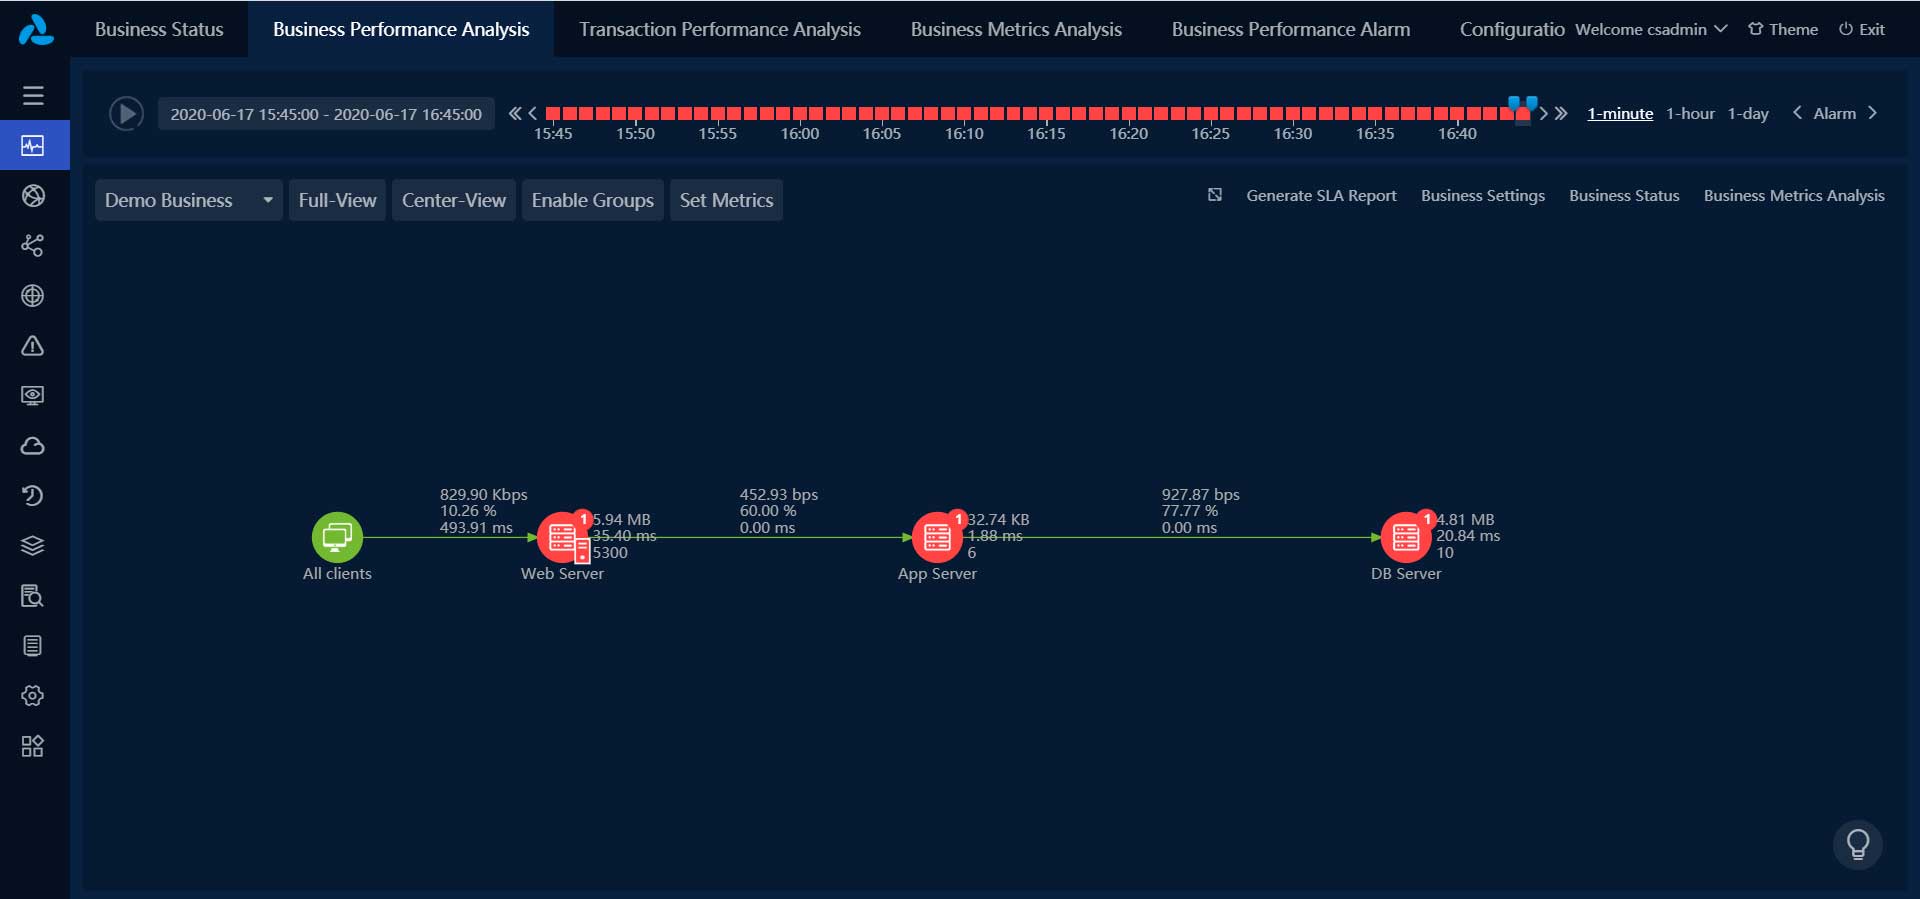
Graphically display key performance metrics and status of the business, quickly locate the link in question.
Reports Based on Probes, Businesses or Applications
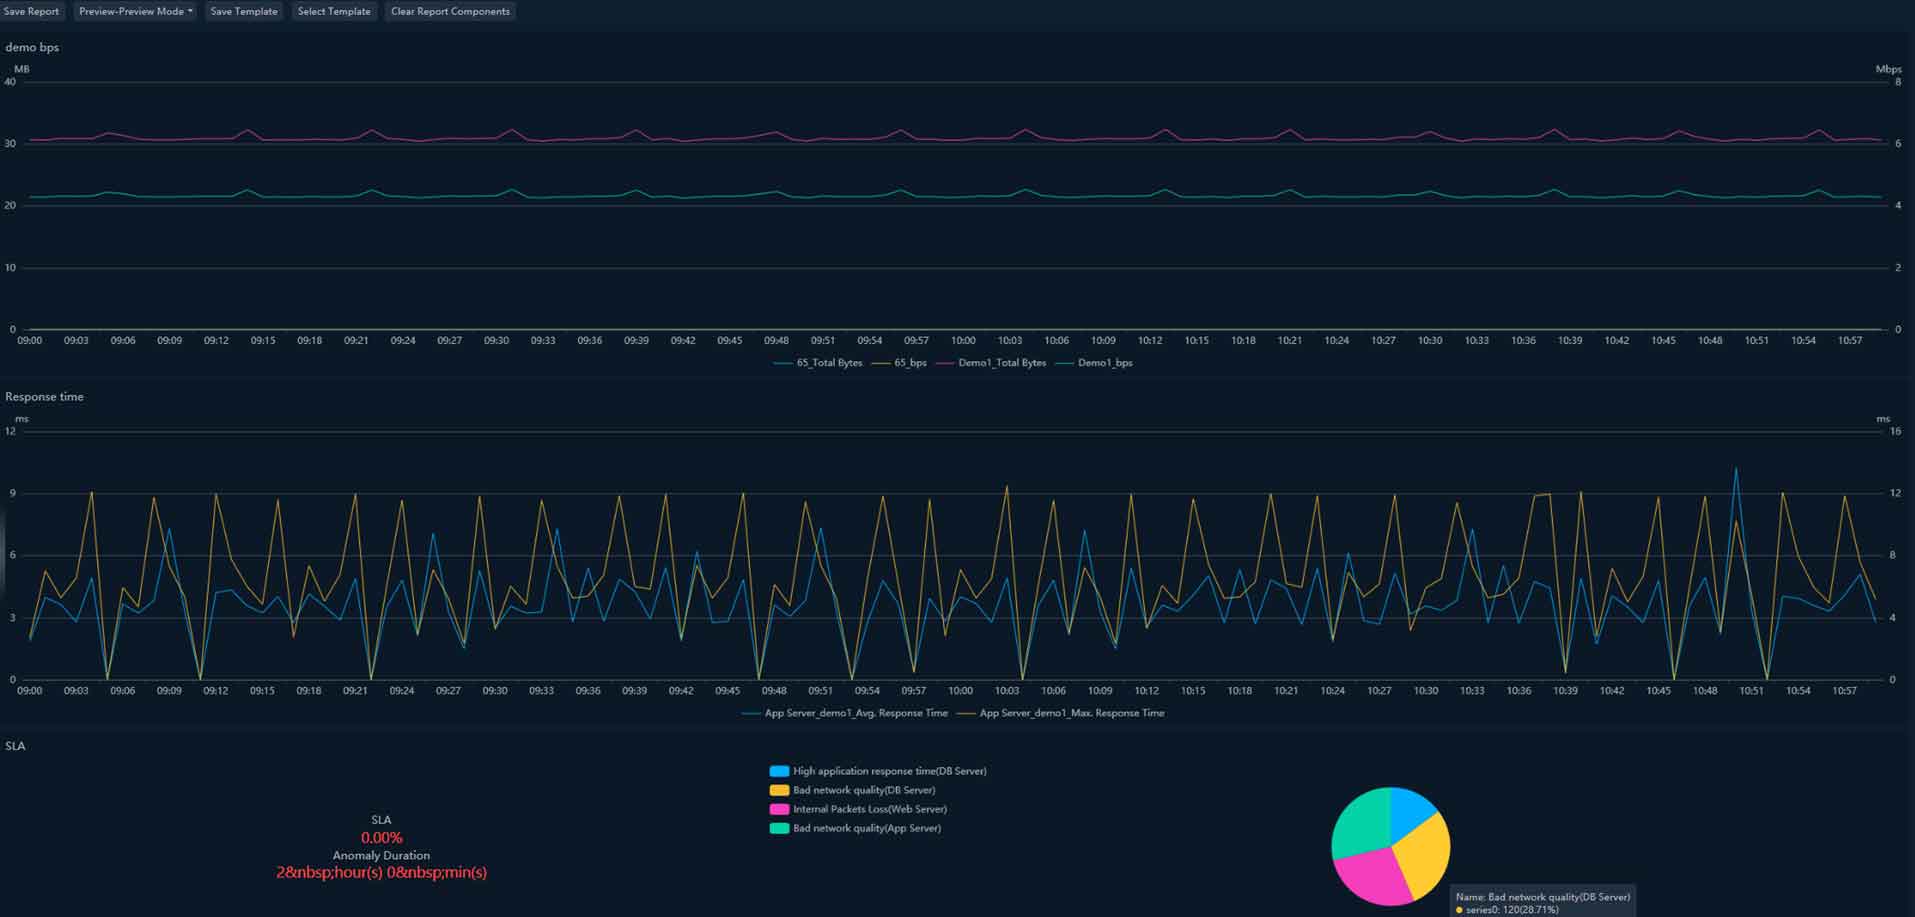
Monitoring results can be generated as SLA reports to help decision-maker to master businesses status.
Multi-segment Correlation Troubleshooting
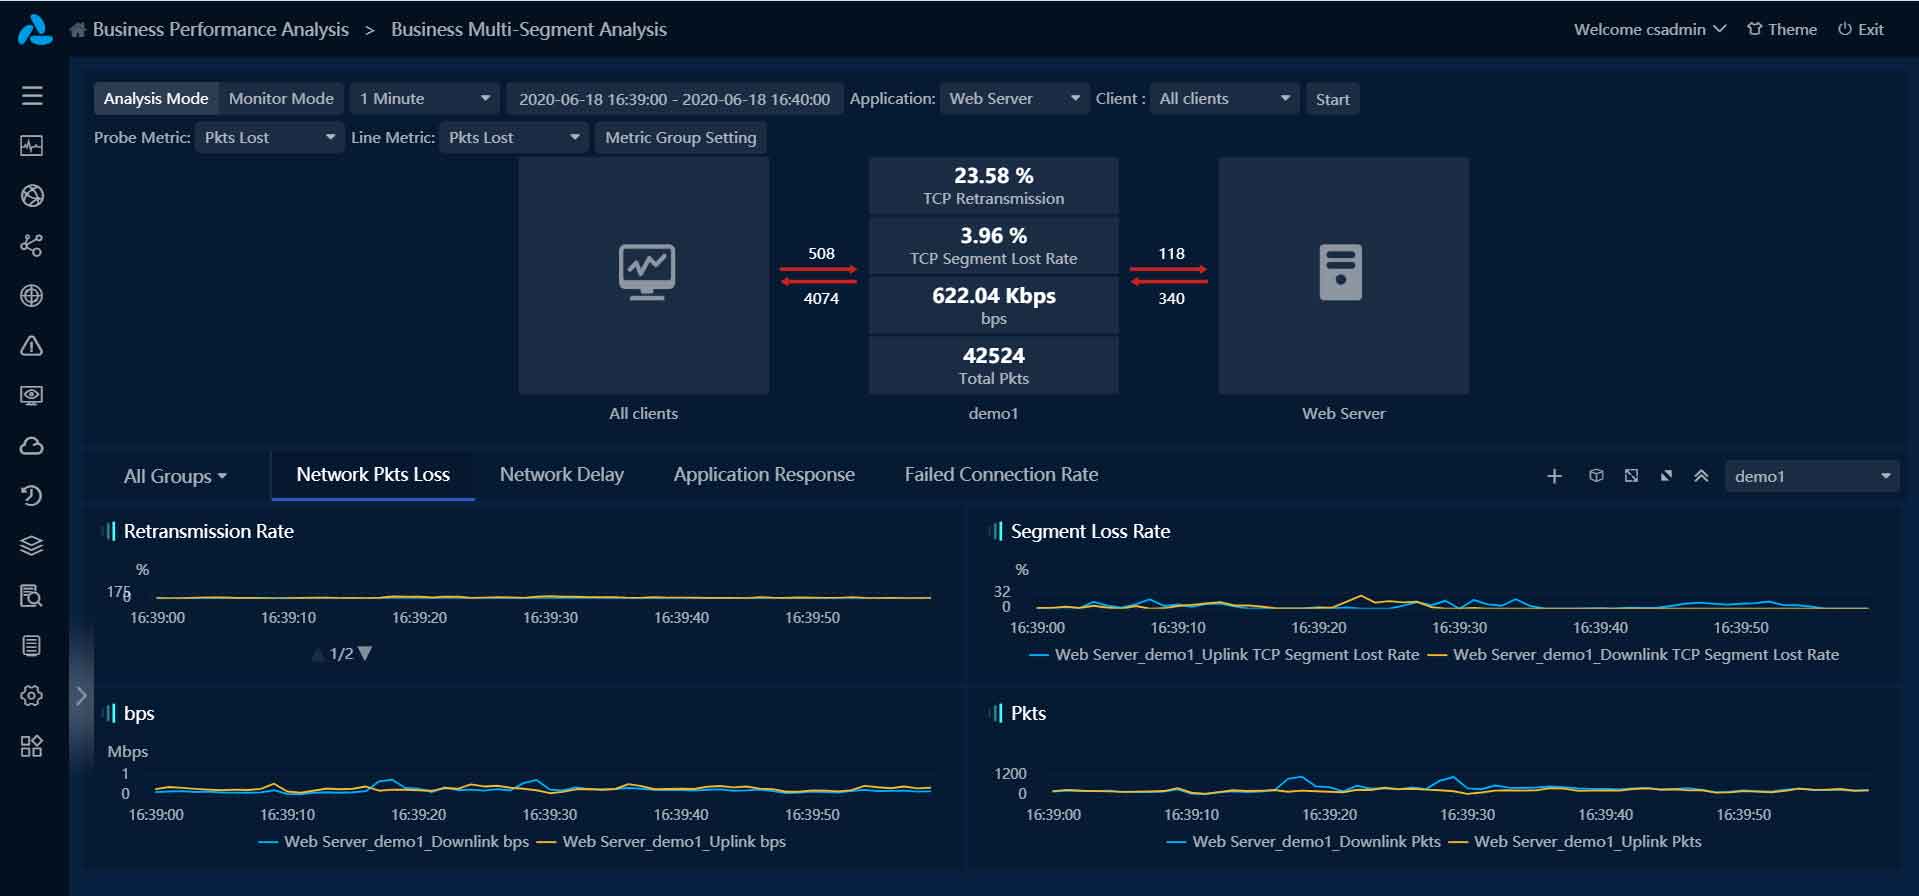
Perform correlated analysis on data at different points to locate network nodes that lead to poor service quality.
Intelligently Application Relationships Discovery
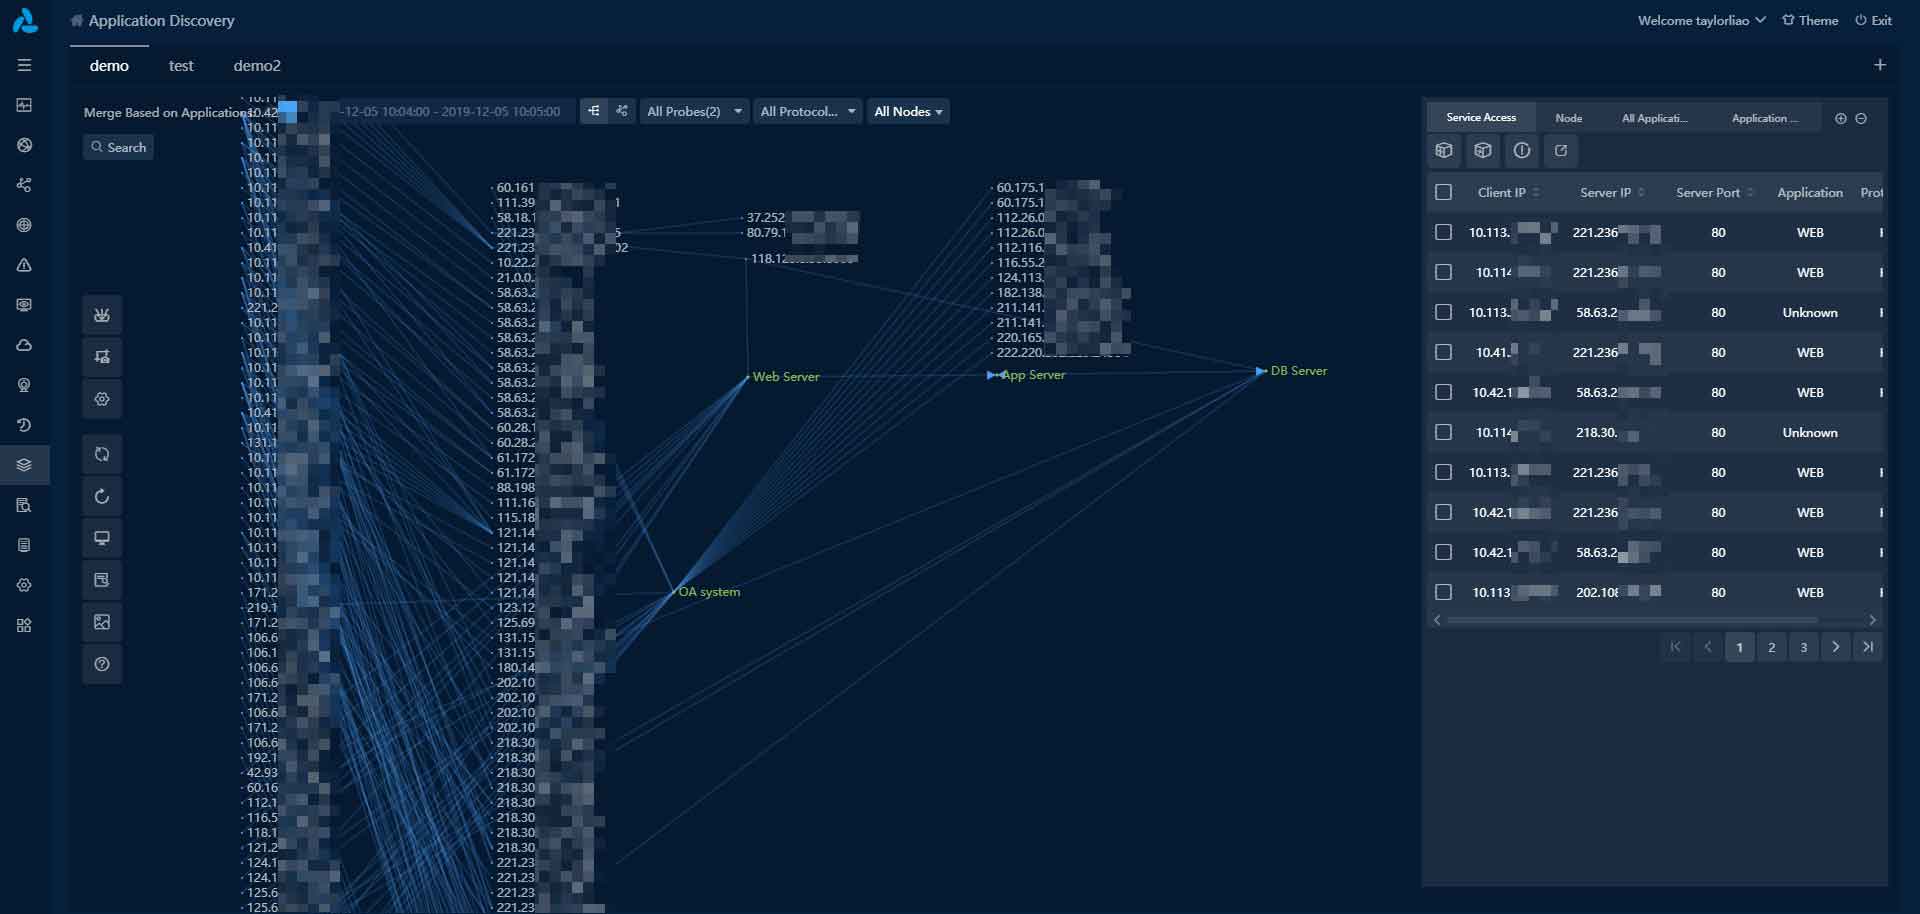
Draw network communication diagram based on the traffic automatically. Show application access relationships.
Packets retrieval and download
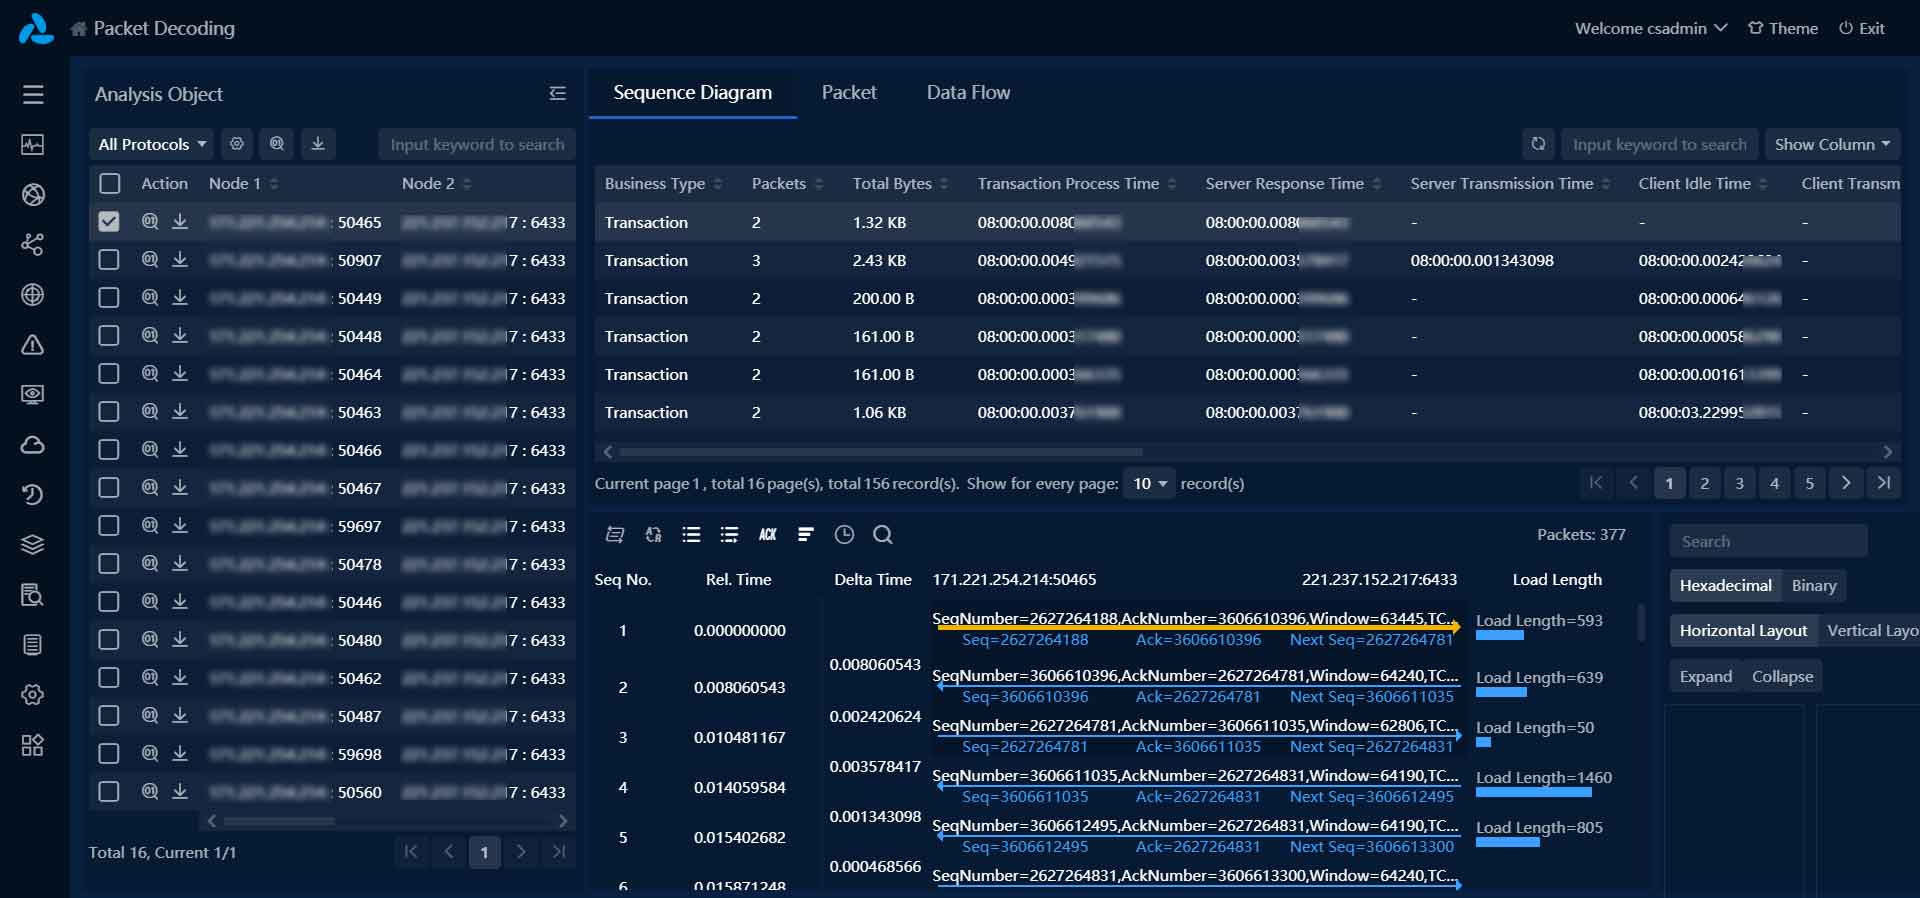
Save, retrieve and download original packets. Online decoding is also available.
System Requirements for UPM Center
System Requirements for UPM Web Portal
- Google Chrome 50 or higher
- Firefox 46 or higher
- 1280 * 800 (minimum)
- 1920 * 1200 (recommended)
For technical specifications about nChronos, please refer to Colasoft nChronos Technical Specifications.
Technical Specification
| UPM Appliance | 3010 | 3030 |
|---|---|---|
| Profile | 1U | 2U |
| Supported Businesses | 30 | 100 |
| Supported Links | 10 | 30 |
| HDD | 8TB | 16TB |
| RAID Model | RAID5 | RAID5 |
| Power(Redundant) | 550W | 750W |