What's New in UPM
What is New in UPM 6.2
Millisecond Analysis
UPM 6.2 supports to analyze link traffic in millisecond level, which makes traffic analysis results more accurate.
The millisecond traffic analysis feature is disabled by default. If users need, the feature can be enabled in system parameter configuration interface. Set the default value ‘-’ of parameter ‘querySupportMillisecondCSRASVersion’ to be ‘6.2.1’, then save configuration.

Conversation Path Analysis
UPM 6.2 supports to automatically recognize the path of a specific conversation.
Through conversation path analysis, users can view the path passing between the two IP endpoints, so users can perform path analysis. After entering the IP address and/or port number, click Start button. The system begins to sort out the conversation path of the IP pair, and displays it in the result with a dynamic flow effect. There are bright spots of different colors in the picture, all of which flow according to the actual path.

What is New in UPM 6.1
Packet Signature Query
UPM 6.1 provides packet signature query feature. Users can create query tasks to query the source IP, destination IP, source port, destination port, source location, destination location and other information in packet’s contents related the set signature rules. The query task also supports stop, re-query, and delete operations.

Log Analysis
UPM 6.1 provides log analysis function for analyzing specified statistics information in history logs.
Users firstly need to configure a log analysis collection, in which users can query full field, wildcard, field, any keyword, etc. Before performing log retrieval, users are able to set conditions like time range and filters.
Furthermore, the new function supports setting log analysis scene. Now supports PPPoE account analysis scene that allows correlating IPs and accounts.

What is New in UPM 6.0
Templates of Custom Monitoring
UPM 6.0 provides templates for custom metric monitoring, which makes metric monitoring more convenient and efficient. Users can save current views as templates and export them as templates files as well. What’s more, users can import templates files to UPM center.

Application/IP Object Analysis
UPM 6.0 provides the object analysis, and its configuration is similar to that of custom metric monitoring. With custom analysis views, users can monitor and analyze relevant metrics of specified IPs or applications they care about.
The object analysis function supports analysis templates, and it provides users with several practical monitoring templates. Meanwhile, users can save their custom views as templates and export them, or import templates files to UPM center.

Optimization of Packets Decoding
UPM 6.0 provides time sequence analysis for packets decoding. With optimization, users no longer need to download and analyze packets with expert analyzer or other tools. UPM 6.0 supports resuming the conversation interaction process, and enables users to quickly and accurately locate the root cause of the network faults.

What is New in UPM 5.6
Online Packet Decode
With previous versions, users have to launch an Expert Analyzer from nChronos Console to decode packets, while with the version 5.6, UPM provides an online decoding feature, which allows users to get the decoding view by just some clicks. The decoding view comprises a packet list section listing the extracted packets, a decoding section showing the protocol fields of the selected packet, and a hex decoding section highlighting the selected field. With the new version, the system extracts packets directly based on the specified conditions and then decode them on web browsers. There is no need to install other programs.

Backup Monitor
To avoid business disruption, data loss, economy and trust loss when a "disaster" occurs, disaster recovery design and regular drills are important for fintech firms. UPM 5.6 provides a backup monitor feature to monitor the switchover scenario for disaster recovery drill process, including the sites which join the drill, the business recovery rate for each site, the transactions, the link status, etc. With the backup feature, users can get a visualized view of the real-time monitor and statistics for the switchover and business validation.

Burst Alarm
UPM 5.6 provides burst alarm type in link traffic alarm to monitor the network traffic. Burst alarm is used to warn of abnormal burst. In order to improve the accuracy of alarm, the system will compare the captured data with those of the previous N cycles. At the same time, the captured data can be also compared with the baseline data and metric data.

Optimized Custom Metric Monitor
UPM 5.6 optimized the custom metric monitor feature, which enables users to customize a metric monitor dashboard with any desired metrics. The system adds a map type for link chart, application chart and business transaction chart. When configuring a new chart, users can choose the map type to monitor link status, application status and business transaction status.

Template function in Report
UPM 5.6 provides a report template function to make it more convenient to set a report. Users can save a configuration as a template and select a template previously saved to set a report.

What Was New in Previous Version
New Home Page
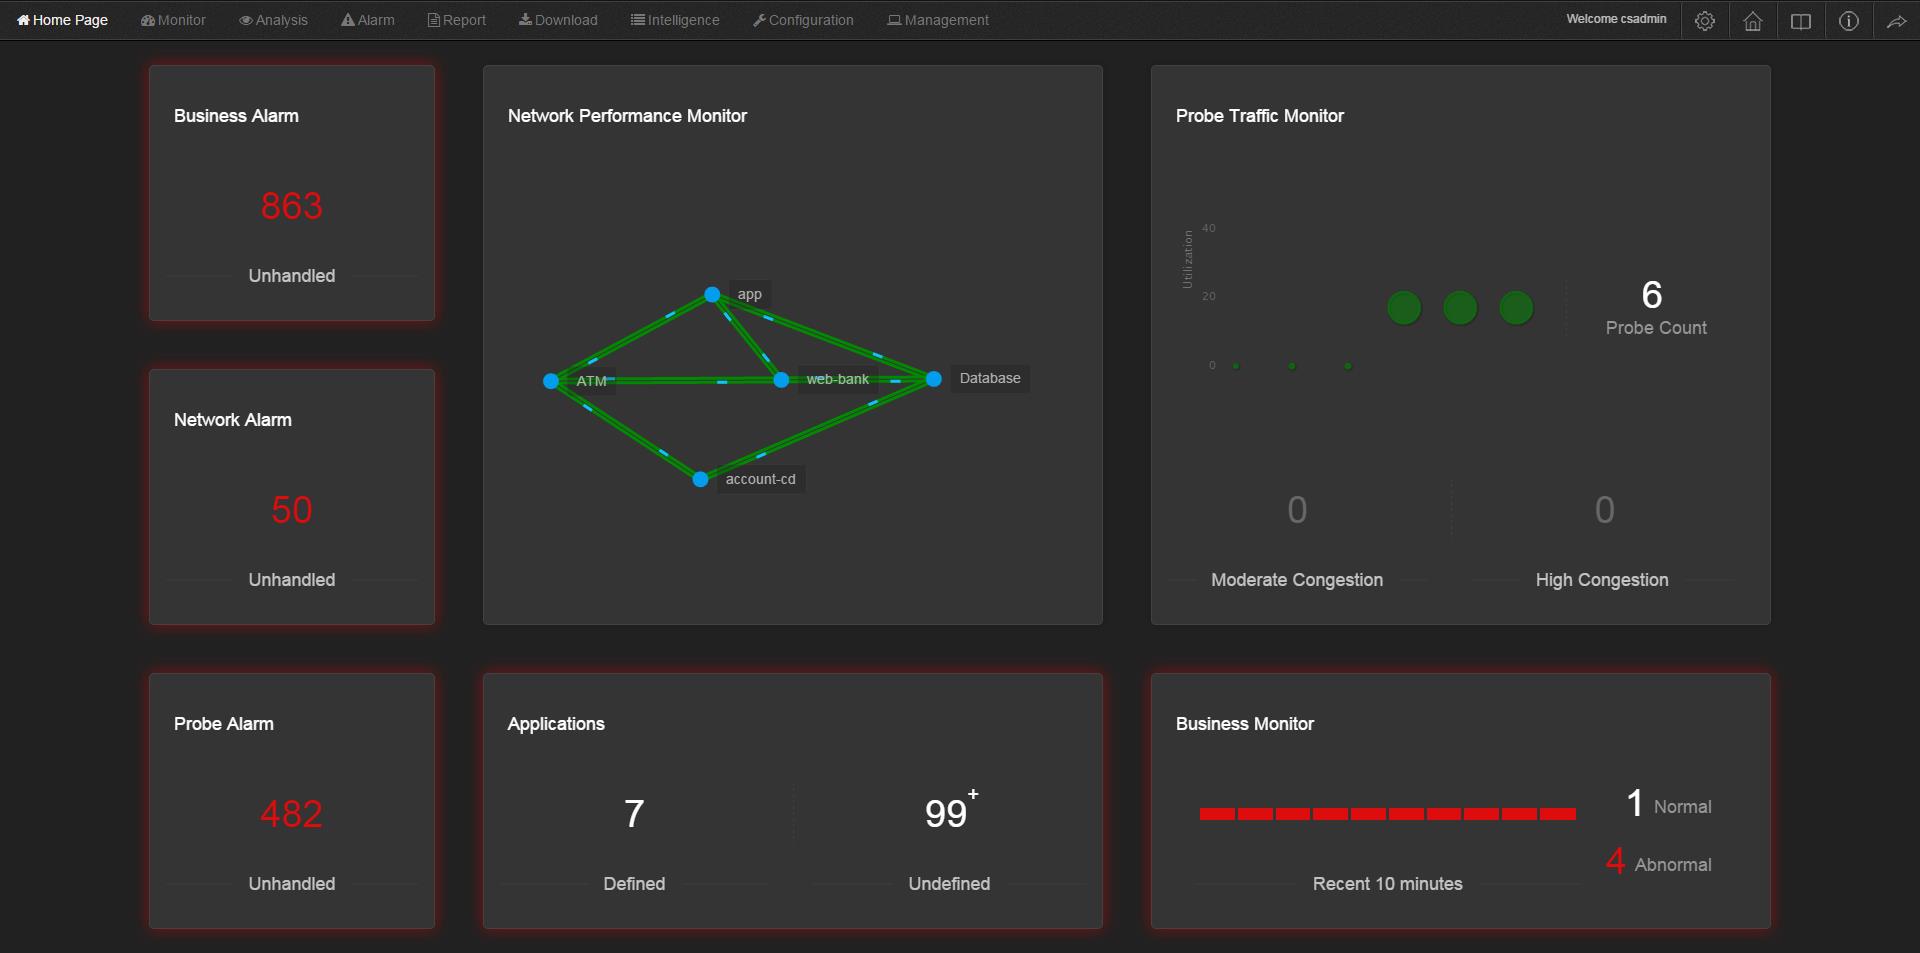
A Home Page is added to display the overall monitor status in real-time, including alarm count and handle status, network performance of communication paths, probe utilization, applications, and business status. You can click each box to open corresponding module to perform detailed monitor and analysis.
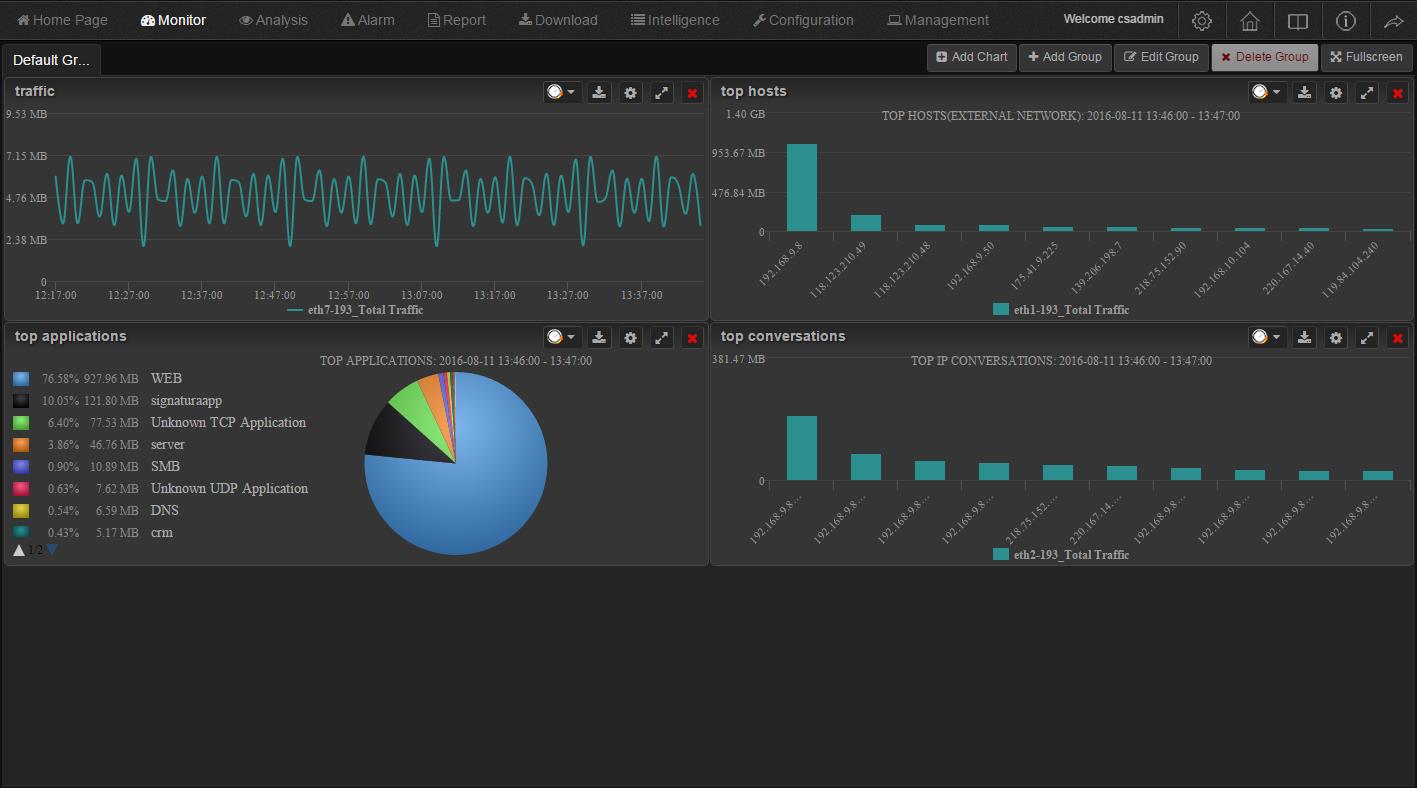
Probe Monitor

UPM Center provides a Probe Traffic Monitor page to display traffic trend charts for each probe. The trend charts can be drawn based on packets, probe utilization, bytes, alarms, packet size distribution and TCP packets. The trend charts could be 1-second scale window, 1-minute scale window, 1-hour scale window or 1-day scale window.
A Probe Index Monitor page is also provided to display indexes for each probe. The indexes could be the statistical items on trend charts, and could be top statistical items. You can monitor multiple indexes for one probe, or compare the index value among several probes.
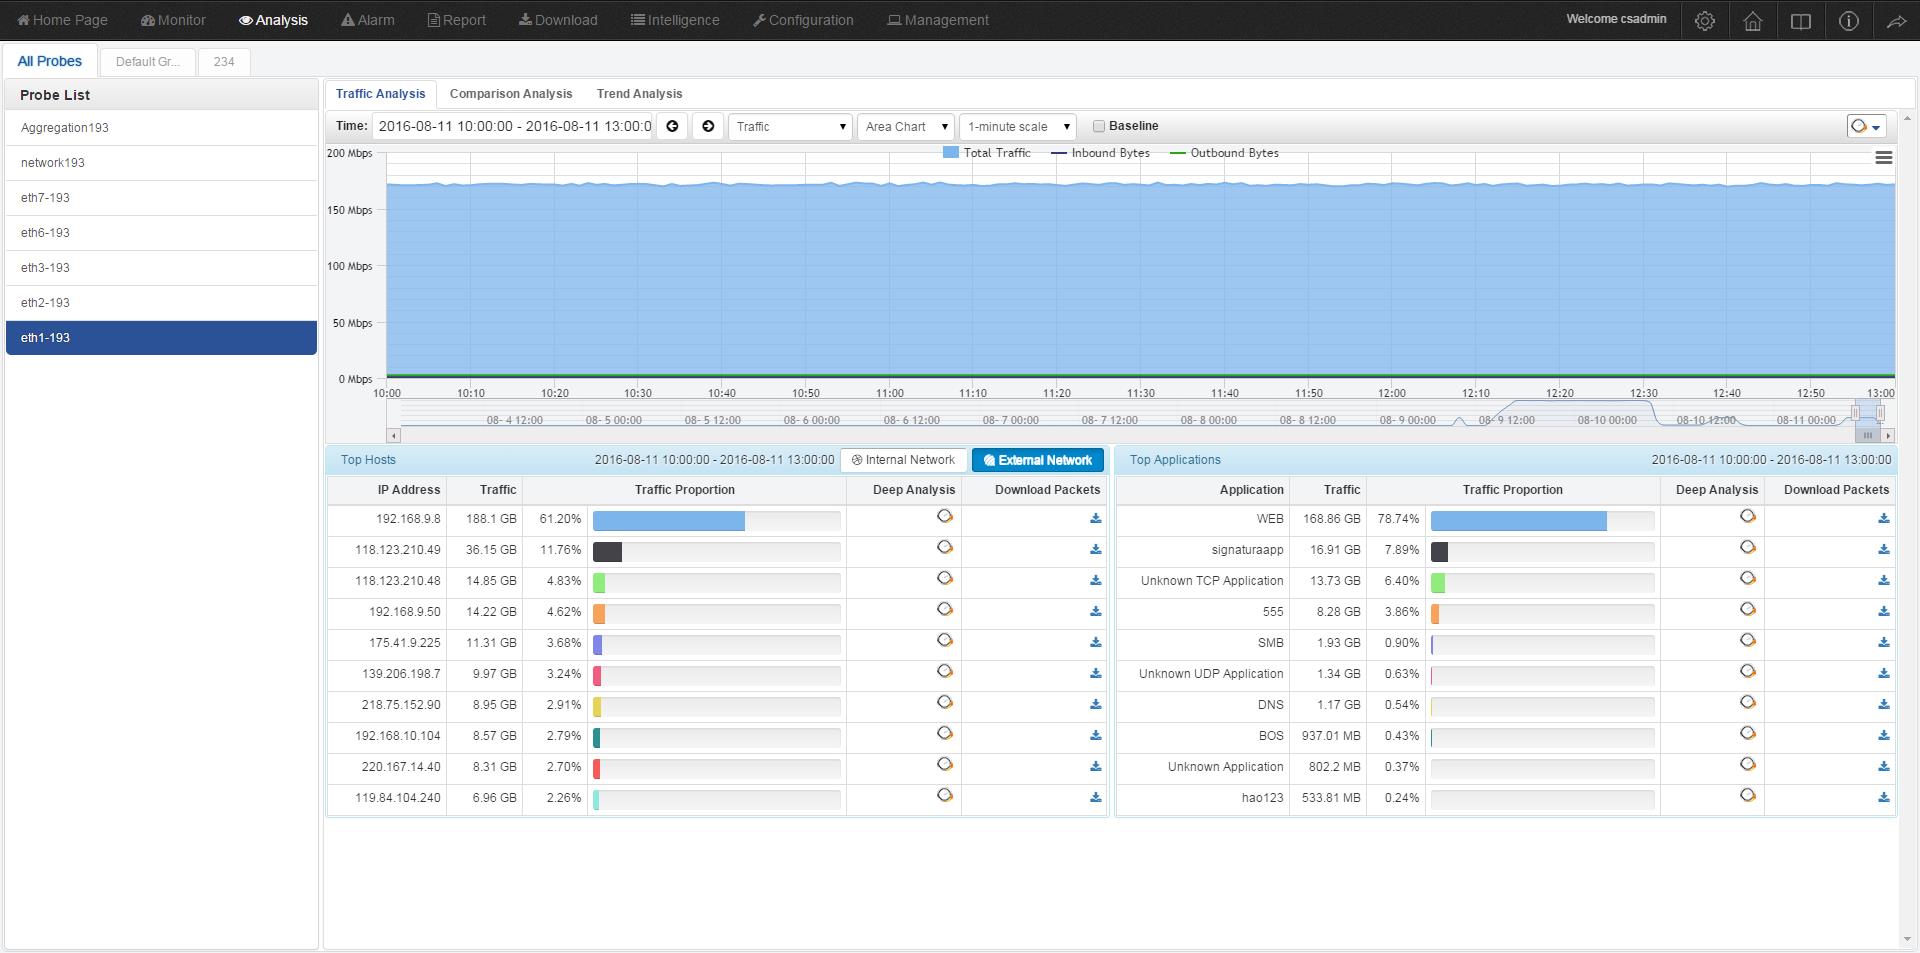
Probe Analysis
A Probe Traffic Analysis page is added to display probe traffic, traffic comparison analysis and traffic trend analysis. You can specify a time range to view a probe's traffic status and check it with its baseline traffic. Traffic comparison analysis is available to show the traffic information in different history time ranges. UPM is further capable of forecasting the traffic trend based on history traffic.
Probe traffic report is provided and can be saved to local. The probe traffic report displays traffic information for the selected probe in the specified time range, including total traffic, packets size distribution, TCP packets, etc.
Business Performance Monitor
Besides centralized business monitor, UPM 5.1 provides business group performance monitor and business global performance monitor. With group performance monitor, user can customize business group and build the relationships between the groups. UPM system intelligently evaluates the performance and graphically displays the running status of each business in the group, so that users can find abnormal business quickly.
With business global performance monitor, users can view the running status of all business nodes and will find abnormal node in a direct way.
Network Performance Monitor
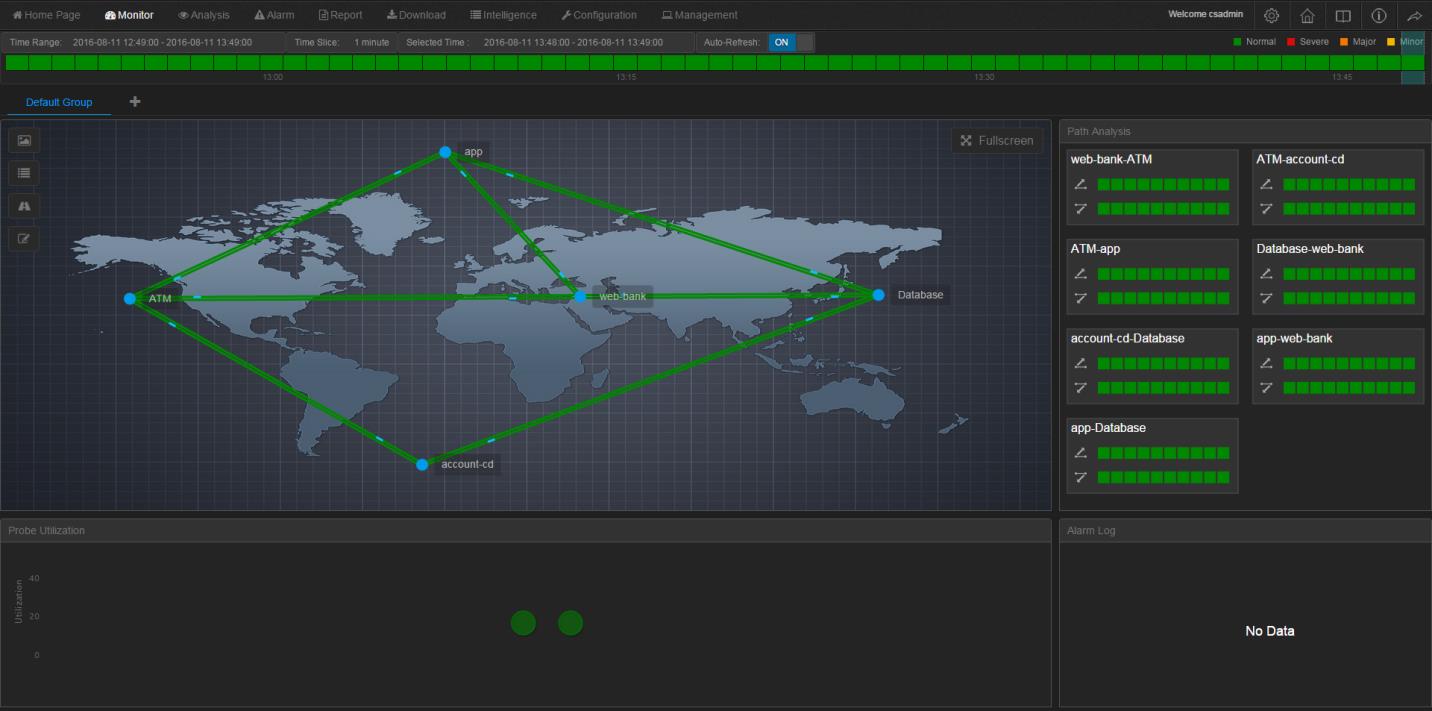
UPM 5.1 provides a Network Performance Monitor page, which allows users to customize network communication paths and monitor the paths in real-time. You can even add a map or a network diagram as a background for the communication paths, which makes the monitor more intuitive. You can click a path to perform detailed path analysis.
Outline Network Communication
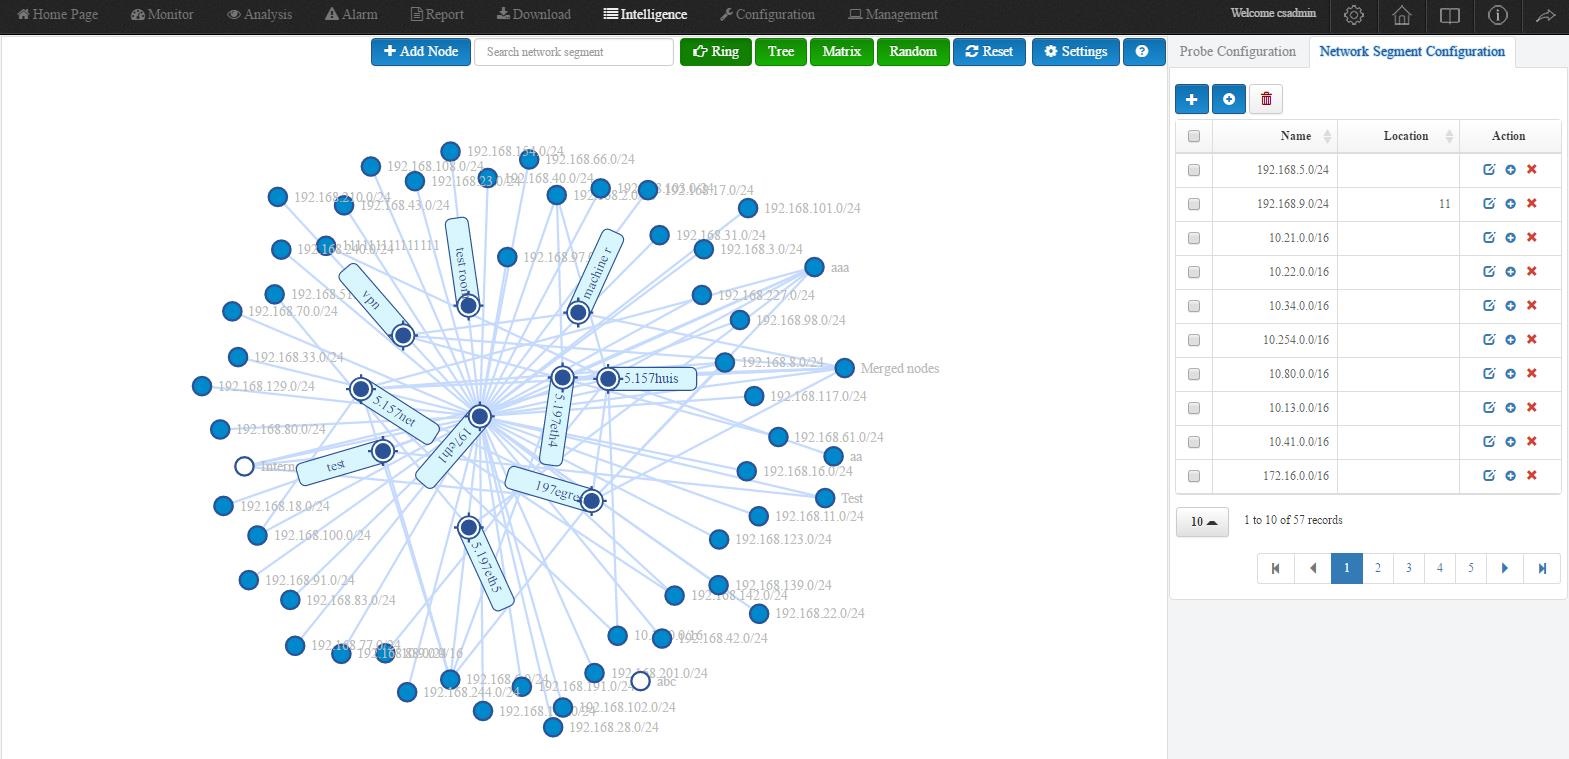
Based on the service visit data from frontend devices, UPM 5.1 graphically displays the visit relationships among hosts and services on the network to thereby help users quickly define network segments, applications and network paths.
Furthermore, network segments can be automatically defined based on the traffic captured by frontend.
Real-time Alarms
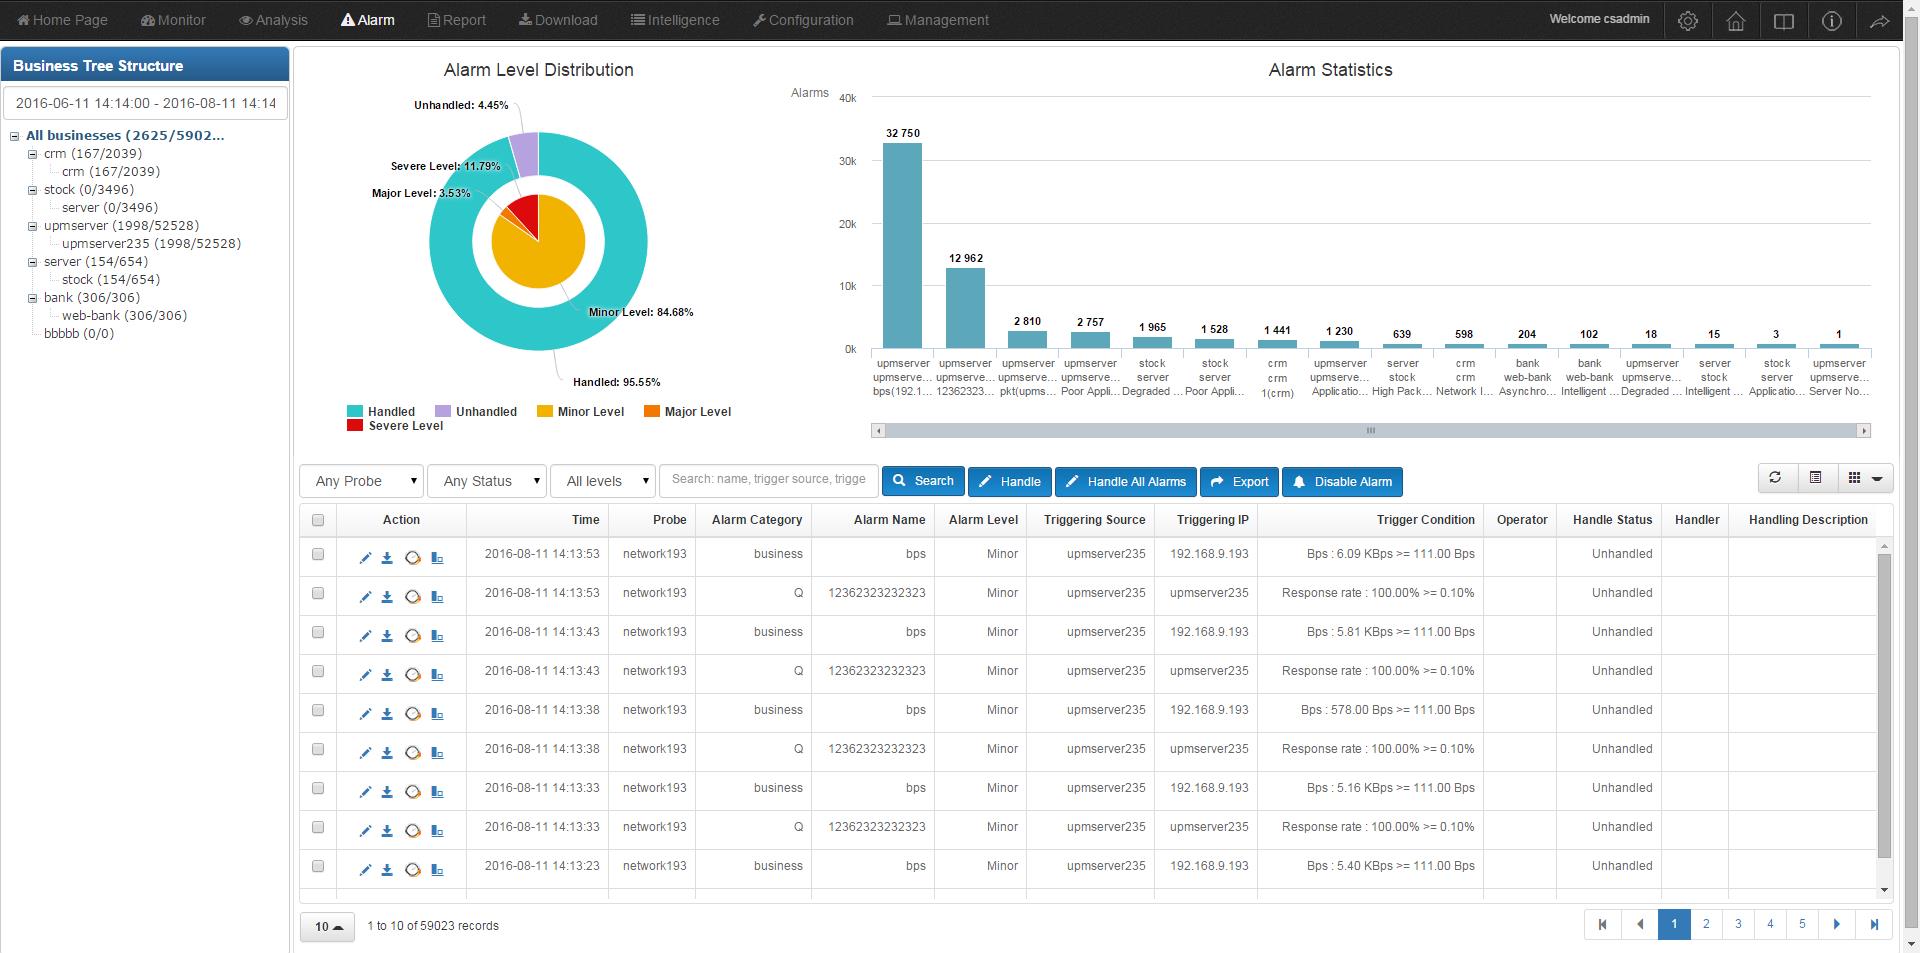
Besides business alarm, UPM 5.1 adds probe traffic alarm and network performance alarm. Users can customize probe traffic alarm, while network performance alarms are built in by UPM. When alarms are triggered, the time line will be colored to indicate different alarm level, and alarms will be displayed on all monitor pages. Furthermore, UPM provides a Probe Traffic Alarm page and a Network Performance Alarm page, which show alarm statistics in doughnut chart and bar chart. An alarm list is also provided to display detailed alarm logs. You can download packet related to that alarm log, or launch nChronos Console to perform deep analysis.
UPM 5.1 also provides other new features. Probes can be aggregated to work as one probe. Packets can be retrieved based on IP address and application, and then be download. Radius authorization is supported. Syslogs can be merged first and then sent. In addition to the new features, UPM 5.1 is optimized a lot, either on user interface or on features.