What's New in Capsa
What' s new in Capsa 15.1
Global Displaying Filter
Capsa 15 provides global display filter for all analysis views. Once a global display filter is set, all views will preferentially use the filter conditions of the global display filter for display filtering.
Source IP address, destination IP address, source IP address and destination IP address, source port, destination port, source port and destination port, protocol, application, process, and timestamp are supported to set as filter rules.

Changing of Tabs Displaying
To coordinate the use of global filters, Capsa 15 adjusts the displaying type of the analysis tabs. If global displaying filter option is checked, users will get the new interface after clicking start button.
In new analysis interface, all the tabs are adjusted to be listed on the left side, makes the interface simpler, beautiful and user-friendly.

Behavior Analysis
Capsa 15 provides a new feature to analyze the network behavior of IP and services according to statistical data such as port, connection client book, number of households, traffic, etc.
IP behavior information statistics can show users the services provided and used on the IP Intranet and extranet. Service behavior information statistics analysis of the service's internal network and external network connection client communication and grouping statistical information.

Other new features and improvements include:
- Add filter expression session. Decrypted payload in TCP conversion, for details see Online help (F1).
- Users can directly set various items of analysis settings on the start page, and can customize the items to be set in the analysis settings.
- Add advanced filtering function for global display filter, users can write the relationship (and, or, not, and group) between each filter item through the advanced filtering function.
- Add judgment prompts for packet view. TCP Window Full (red), TCP ZeroWindow (red), and TCP Window Update (prompt).
- Add exporting pictures function to transaction sequence diagram in TCP transaction analysis.
- Add conversation TTL field for TCP conversation and UDP conversation.
What' s new in Capsa 13.0
Network Profile and Analysis Profile are merged to Analysis Settings
Capsa 13 merges all the settings of Network Profile and Analysis Profile to Analysis Settings. The change provides user more flexibility in setting the analysis configurations when analyzing traffic. Unlike previous versions, there is only one default setting named Default in Capsa 13. Users can also create, edit, duplicate, and delete analysis settings by right-clicking anywhere on Analysis Settings. For adding new analysis settings for specific objects, users just need check the related analysis modules.

Internet IP Device Identification
Capsa 13 provides a new feature to identify the names and types of the device corresponding to the specific IPs. Just check the Enable External IP Device Identification option to enable the feature. Users can view all the corresponding information from the Explorer Window. When a device is chosen on Node Explorer, the analysis views display analysis results only related to the chosen device. You can click a specific IP address, and the right pane displays statistics views only related to the IP.

Other new features and improvements include:
- Replay analysis supports wireless packets decryption.
- Users can locate related conversations from the Diagnosis Details tab.
- Packets can be exported in libpcap-nanosecond type.
- Analysis settings are independent per project.
- Users can configure whether to stop analyzing when available memory is less than a specified threshold.
- Users can view traffic logs on lower panes.
- In DPI filter mode, conversation views support script-based display filters.
- Reconstructed files will be saved in one file folder every 1,000 conversations.
- Format-supported trace files can be replayed without file extension.
What' s new in Capsa 12.0
Full Traffic Decoding
Capsa 12 adds a new analysis profile, Full Traffic Decoding. Users can use this Full Traffic Decoding analysis profile for analyzing packets. The new analysis profile is used for displaying the decoding field of a certain protocol. And we also can get the correlative decoding field value, conversation statistics and packets information quickly. It's more convenient for users to view the protocol decoding field and related statistics. Please notice that only when a specific protocol is selected under the Node Explorer, the statistics can be displayed.

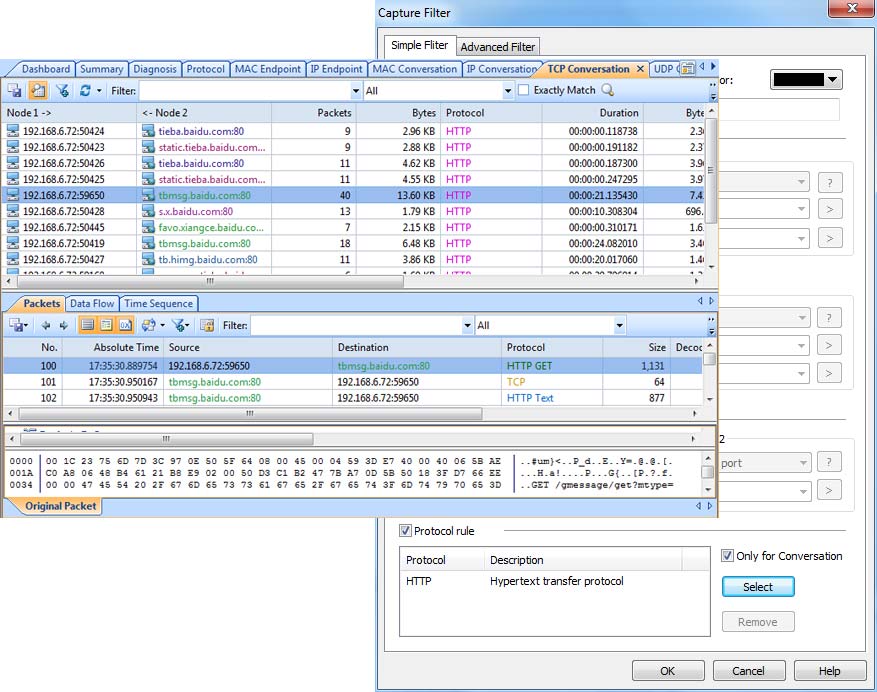
DPI Filter
In the past versions, if we want to make filters for capturing, saving and displaying packets, we need to click "Capture Filter" and set up filter conditions in the pop-up window. Users can't customize the filter conditions by their needs. In the new version, we use the DPI filter to filter out network packets. Users are able to make filter conditions by themselves. And all the filter statement must follow the Expression Rule. Assume that we want to make a display filter for a specific IP address "192.168.1.1" in Capsa 12 version. We can write the statement "ip = 192.168.1.1" in filter box of Packet view and then the lower pane will display the packets related to IP address "192.168.1.1". Technically, all the protocol decoding fields can be set as the filter condition. Also, Capsa provides some default filter rules based on protocols in Packet Analysis Filters Settings and Packet Storage Filters Settings.

TCP Graph Stream
In order to show window size and RTT value of each TCP conversation more directly. Capsa new version provides a new function to show the metrics. In the TCP Conversation view, right click a TCP conversation and select the option "TCP Graph Stream", then we can get the graph about window size or RTT value. It's more convenient for us to locate performance issues based on TCP conversations.

Decoding Script Editor
Capsa 12 adds a new tool, Decoding Script Editor. This tool aims to help users to decode the packet content fields according to their needs. For example, assume that users just want to get the packet fields "Call ID" of SIP packets. With the Decoding Script Editor tool, they can write a decoding script, and then decode the packet fields "Call ID" separately, not the whole content fields by default.

Other new features and improvements include:
- Add UDP time sequence diagram and UDP conversation analysis feature.
- Add national flag to geolocation.
- The analysis for huge packets is optimized.
- Users can customize column width or set the column width to default by right-click or shortcut.
- Users can modify time display precision via Options -> Display Format -> Time precision.
What' s new in Capsa 11.1
Replay Specific Packets
Capsa 11.1 supports replaying specific packets according to users' requirements. In the past, if you add several packets to the Replay window, Capsa replays all the packets at the same time. With Capsa 11.1 , users now can select specific packets to replay according to their requirements. For example, if users add three packets to the Replay window, but only want to replay the first two packets, they just need to check the box in front of packets and Capsa will replay packets except the third one. Capsa 11.1 makes it more convenient for users to replay specific packets.

Packet Storage Filter
Packet Storage filter is one of the most useful functionalities that are added to Capsa 11.1. It is used for storing particular packets. In previous versions, Capsa storages all the packets that are captured by default.With Capsa 11.1, if users enable Packet Storage Filters, they can only save those packets they are interested in. For example, if users only want to save the packets of ICMP protocol for replaying, they just need to enable this function to save the ICMP packets. Somehow, using Packet storage filters can save the storage space of local disk. The filter conditions only apply to storage, it won't affect the packets we are monitoring and analyzing in real time.

Import and Export Advanced Display Filters
Advanced Display Filters can be used in TCP Conversation view, UDP Conversation view and Packet view. Users can enable Advanced Display Filters and view specific packets. Capsa 11.1 is able to import and export advanced display filters. For example, if users reinstall Capsa on a new machine or update it to a new version, there is no need to configure Advanced Display Filters by manual, they can simply export Advanced Display Filters first and then import it to the newly installed Capsa.

Other new features and improvements include:
- The IP address library is updated.
- The log view is sorted by packet timestamps.
- Sorting conversations by time as default.
- The function of packet compulsive decoding is optimized.
What' s new in Capsa 11.0
Reconstruction function
Capsa 11 is able to extract and fully reconstruct the files transmitted over FTP, TFTP, and HTTP, as well as SSL certificates. The new version can extract data from captured packets to reconstruct them to corresponding files. Users can set the saved path of the restored files in the Analysis Profile Settings so that they can be viewed in the corresponding path. And SSL Certificate Reconstruction function is to reconstruct the certificates transmitted over the SSL protocol, such as HTTPS, SMTP/SSL. By default the reconstruction function is not enabled.

IPv6 analysis
Capsa 11 provides IPv6 packet analysis, including endpoint analysis and conversation analysis based on IPv6 protocol. In the Packet view, if users want to see only IPv6 packets, the Advanced Display Filter can be set to achieve it. Users can see the information of IPv6 packets in the Packet, IP Endpoint and IP Conversation views.

RTP Configuration
Capsa 11 provides the function that RTP media flow can be analyzed when signaling packets are not captured. Signaling packets contain the encoding methods for audio and video, if there is no signaling, the decoding method to reconstruct RTP flow cannot be determined, it means that audio and video files cannot be reconstructed. Therefore, the new version provides the RTP configuration to reconstruct the audio and video in RTP packets without signaling. Users can choose the proper encoding type to read the RTP media flow.

Other new features and improvements include:
- An SSL Log sub-view is added to the Log view
- An X-Forwarded-For field is added to the HTTP Log view
- The file path for last replay can be remembered
- A "Path" column is added to the Replay tab to display the path of the packet file
- The display of top charts is optimized to make it more regular
What' s new in Capsa 10.0
VoIP analysis
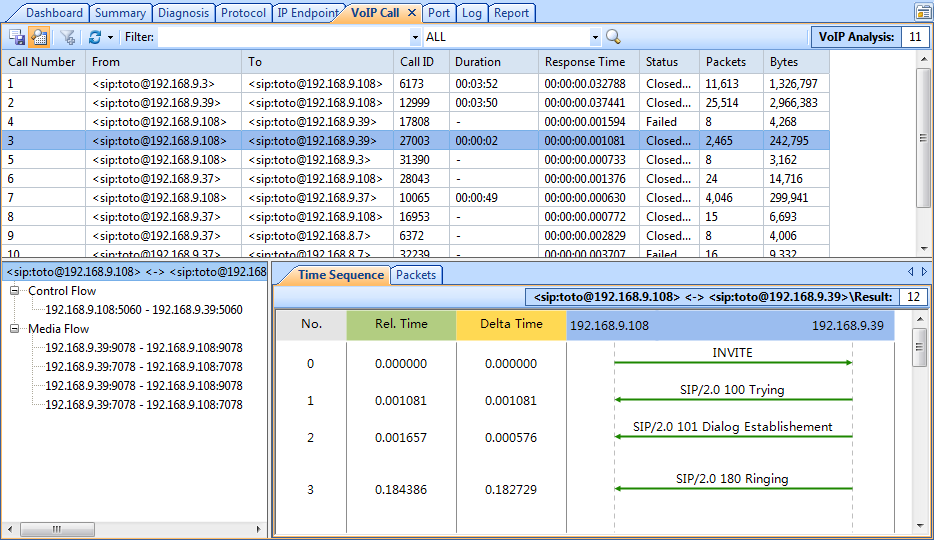
Capsa 10 improves the VoIP analysis feature. The new version supports both SIP and H.323 protocols, and is able to play back voice and video files. A brand new VoIP analysis view is provided to display VoIP call statistics, like MOS-A/MOS-V distribution, call status, codec type, etc., to display network traffic information for VoIP calls, and to display SIP/H.323 statistics.

The original Call tab is also improved to display each VoIP call, and to analyze each VoIP call process. Just double-click a voice or a video media flow; a player will launch automatically to play the audio/video file.

Furthermore, new VoIP charts, VoIP report modules, and VoIP diagnosis events are added to the new version.
TCP Conversation analysis
With Capsa new version, the TCP Conversation view adds a column Interaction Diagram, which displays the packets interaction status for each TCP conversation. Just by a glance on the Interaction Diagram, you will know the TCP conversation information, if there is retransmission or not. The scales on the diagram indicate the number of payload packets, green indicates request packets, blue indicates response packets, and red indicates retransmission packets.
A Payload column is added to display the payload data for each TCP conversation, and a Max. ACK Time column is added to display the maximum transport layer ACK time for each TCP conversation, which is helpful for analyzing TCP conversations.

With the new version, TCP flow analysis optimizes the algorism for TCP transactions and adds new metrics for TCP transactions, like server response time, transaction processing time, client idle time, etc., which facilitate the analysis of TCP transactions.
What' s new in Capsa 9.2
Application Analysis
Capsa 9.2 provides application analysis feature, which makes application-based traffic analysis available. More than 1,800 built-in applications are provided, including the popular Web application, Email application, network management application, etc.
Users can also customize applications based on IP address, port number, protocol, pattern, and combinations thereof.
An Application view is provided to show all the traffic statistics for applications, including total bytes, packets, Bps, bps, pps, etc. Once an application is selected, the lower pane will show protocol and conversation information related to that application. Double-click an application, the Packet Decoding window will open to show packets related to that application.

An Application Explorer is provided to display the applications that have network traffic and works as a display filter.

For example, you can first go to the Application view to find the desired applications, and locate it to the Node Explorer. Then, the views on the right shows data related to that located application. You can go to the Summary view to check traffic statistics, and go to the conversation views to see conversation information.
HTTPS Decryption
Capsa 9.2 enables users to decrypt the HTTPS message with the right configuration of key file. There are three common decryption method: RSA, PSK, and (P)MS log file. Capsa supports all of these three methods. Users could choose either to edit the RSA key list, to use a PSK, to import a (P)MS log file, or even to use them all simultaneously for the decryption.

Before the decryption:

After the decryption:

Select Medium Type
Capsa 9.2 allows users to do packet analysis with a specified medium type.
The default medium type will change for different networks to capture the packets. The wired network interface card is defaulted as Ethernet, and the wireless network interface card is defaulted as 802.11. When replaying the packet, it is defaulted to follow the medium type of the packet files.
With some special mediums, which do not fit the default medium type, users could specify a medium type and Capsa 9.2 will analyze the packets with this specified medium type.
Using the right medium type makes packets analysis more accurate.

Besides above new features, Capsa provides following new features and improvements:
- A Base64 Codec tool is provides to facilitate the encoding and decoding with Based64 codes.
- A Dup Ack mark and a Retransmission mark are added to the Summary column on the Packet view.
- The display on HiDPI screen is optimized.
- A Bearer Protocol column is added for port statistics to display transport layer and application layer protocols.
- The display of top charts is optimized to make it more regular
What's new in Capsa 9.1
Conversation Filter
Capsa 9.1 provides a Conversation Filter, which would help users filter the conversations captured by Capsa. Conversation Filter applies to MAC conversations, IP conversations, TCP conversations, and UDP conversations. Capsa 9.1 allows users to set Conversation Filter rules according to address and port, location, conversation protocol, conversation packets, conversation content, and conversation options. All the rules can be related to each other with logical AND/OR relation. Once Conversation Filter is enabled, only matched conversations will be displayed on conversation views.

Packets can be decoded as specified protocol
Capsa 9.1 provides a new feature, which allows users to decode packets as a specified protocol. To some problem packets, which deceive the protocol auto-diagnose system, now users can specify a protocol and Capsa 9.1 will decode the packets according to the specified protocol.

Packets can be filtered based on time rule
Capsa 9.1 provides a new filter rule which allows users to filter packets according to a scheduled time range. Through this feature, users can define when to capture the packets and when not to.

A Time Sequence tab is added for DNS-based conversation
Capsa 9.1 provides a Time Sequence tab for DNS-based conversation. With this feature, user can view the detailed DNS domain name resolution process.

Capsa 9.1 also made some improvements. Name Table now can be exported as .csv format. You can first export Name Table as a .csv file, add names and addresses to that file, and then import the file to Capsa 9.1 Name Table. With this feature, addresses and names can be added to Name Table in batch.
Other new features and improvements include:
The protocol PPP for POS can be recognized and decoded.
An option is added to show/hide address location.
An option is added to enable/disable the automatic loading of packet files replayed last time.
What' s new in Capsa 9.0
Network traffic analysis based on local processes
Capsa 9 provides a Process view, which shows the network traffic information for local processes, listing process name, process ID, bytes and packets data for the process name and process ID. Once a process is selected, the lower pane will show protocol and conversation information related to that process. Double-click a process, the Packet Decoding window will open to show packets related to that process.

A Process Explorer is provided to group all local processes that have network traffic and works as a display filter. Once a process node is selected on the Node Explorer, the statistical views on the right pane will show data related to that process.

For example, you can first go to the Process view to find the desired process, and locate it to the Node Explorer. Then, the views on the right shows data related to that located process. You can go to the Summary view to check traffic statistics, go to the conversation views to see conversation information, and go to the Diagnosis view to check network events.
With this local process analysis feature, you can easily determine what applications and programs on your local machine are generating network traffic.
Besides this new feature, Capsa 9 provides some improvements on Colasoft network tools, including Colasoft MAC Scanner and Colasoft Ping Tool
What' s new in Capsa 8.2
Traffic Analysis of 2-Channel Wireless AP
Capsa 8.2 is capable of traffic analysis of wireless AP with 2 channels. Users can choose up to 2 wireless channels to analyze the total traffic which greatly enhances the accuracy of wireless traffic analysis.

Hex Display of Decoded Data
Hex display of decoded data is supported in Data Flow sub-view in TCP Conversation view and UDP Conversation view. Users can switch the display format between hex and text.

Data Flow Display Optimization
The display is optimized in Data Flow sub-view in TCP Conversation view and UDP Conversation view.
Protocols Recognition Enhancement
With the continuous improvement of CSTRE (Colasoft Traffic Recognition Engine), Capsa 8.2 is capable of recognizing up to 1546 protocols and sub-protocols, which covers most mainstream protocols in the network.
What' s new in Capsa 8.1
Brand-new 64-bit Version
A maximum of 100,000 analysis objects are supported and total idle RAM can be set as packet buffer size in the 64-bit version of Capsa.
Online Auto Update
The feature of online auto update greatly simplifies the update process. Users can easily and quickly experience new version of Capsa when receiving new installation packets over the Internet.
Conversation Filter
Conversation filter is added for quick problem location when users want to analyze conversations with a certain protocol. It is only available in protocol filter and only applies to conversations. Take HTTP conversation filter for example, only HTTP conversations will be displayed in the TCP Conversation view when it is set, but all the packets captured will also be displayed in other views.
What' s new in Capsa 8.0
Third-generation Colasoft Traffic Recognition Engine (CSTRE)
Capsa Network Analyzer 8.0 is based on the Third-generation Colasoft Traffic Recognition Engine (CSTRE), which substantially improved the accuracy and efficiency of protocol & application recognition. 83 new protocols are supported, Capsa 8.0 now supports more than 900 protocols and sub-protocols.
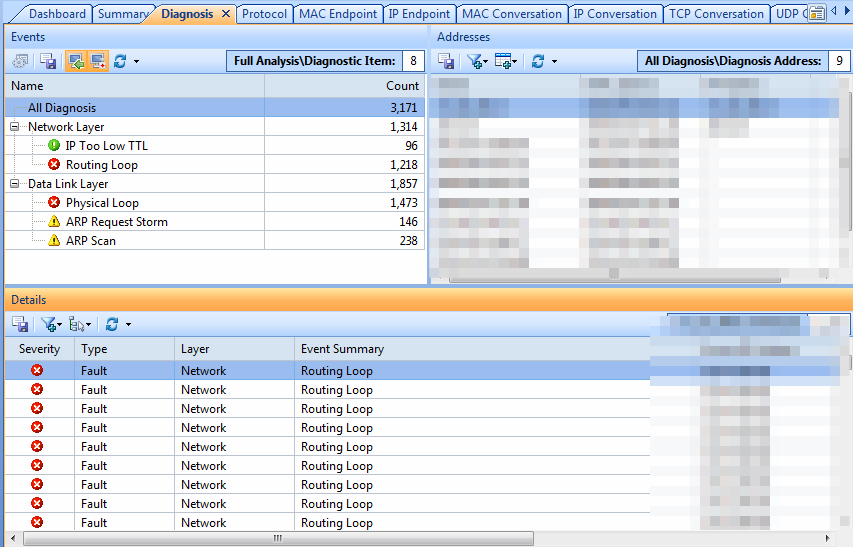
Expert Network Loop Diagnosis
Two Expert Diagnosis Events are added to Capsa 8.0, they are Physical Loop Diagnosis and Routing Loop Diagnosis. Capsa 8.0 makes it very easy for network administrators to locate network loop anomaly without looking into any packet details.
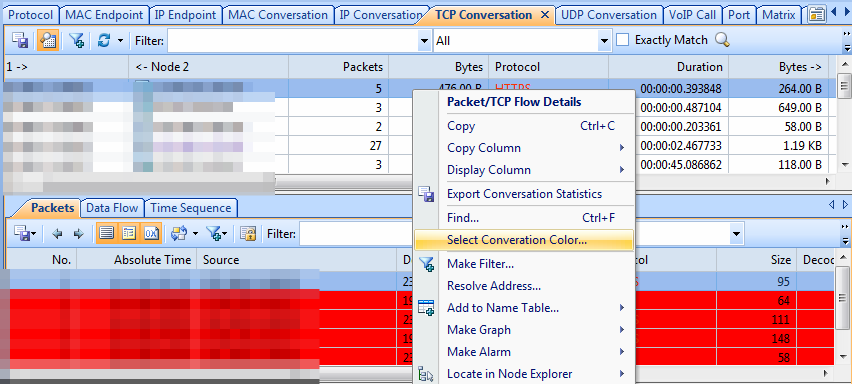
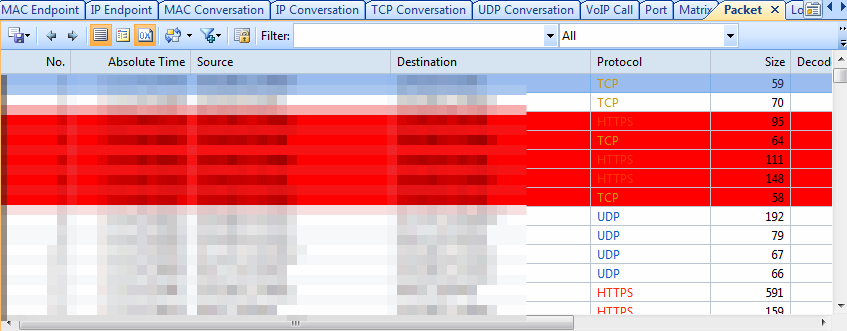
Conversation Colorization
Conversation Colorization is another useful functionality in Capsa 8.0. You can colorize any Conversation in the MAC Conversation View, IP Conversation View, TCP Conversation View and UDP Conversation View. Packets related to that Conversation will be colorized automatically with the same color. The relevance between a session and a packet is enhanced by colorizing packets which greatly improves performance analysis efficiency.
Auto-resolve Host Name and Domain Name
Capsa 8.0 is can actively resolve host names and domain names. You can set up this function and resolve all the host names and domain names in your network. It is more simple and straight to review host names and domain names than purely IP addresses. Moreover, all the resolved names can be saved to your name table.
Start Capsa from the Command Line
You can start Capsa from the command line. You can both start a new capture or replay a packet file from the command line. Follow the steps below to learn how to start Capsa from the command line.
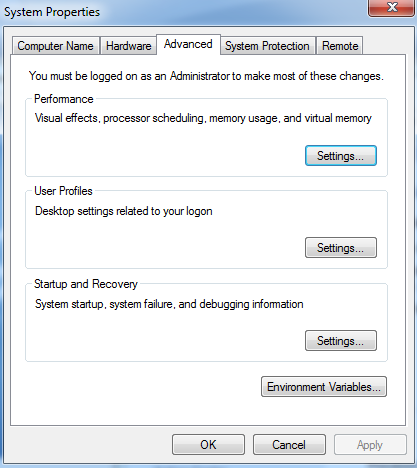
- Right-click Computer on the desktop, choose Properties, then a dialog box pops up.
- Choose Advanced system settings, the dialog box of System Properties pops up as shown below:
- Click Environment Variables, a dialog box pops up as shown below:
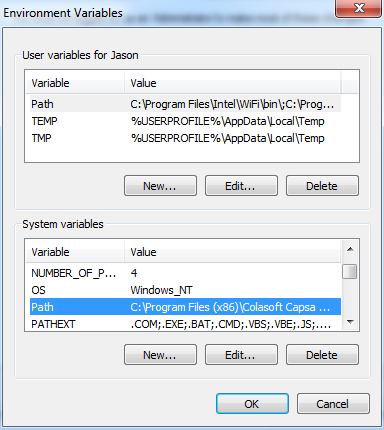
- Choose Path in System Variables, click Edit, the dialog of Edit System Variable pops up as shown below:
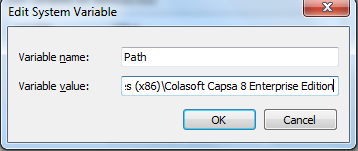
- Add the path of the file named "cmdl.exe" to the input box of Variable value, separate the new path from the existing path with a semicolon in English.
- Click OK, then environment variables setting is finished.
After finishing environment variables setting, users should verify whether it is successful. The steps are shown below (Take Windows 7 flagship version for example):
- Click Start, input "cmd" in the box of Search programs and files, click Enter, then the window of cmd pops up.
- Input "cmdl /?", click Enter, if there is the content as below, it means the setting is successful:
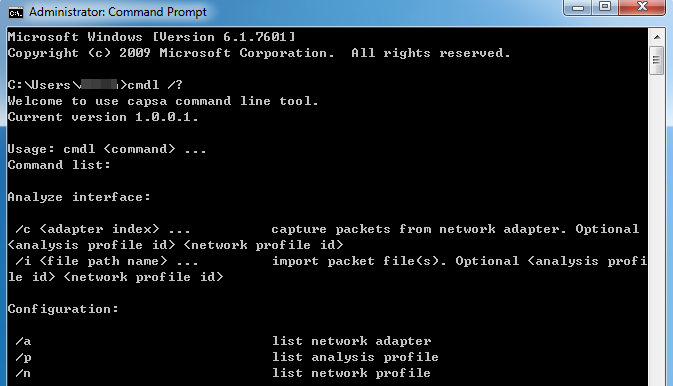
- If there isn't such content as above, please check whether environment variables setting is right.
For more functionalities of Capsa 8.0, please click here(http://www.colasoft.com/support/update.php) .
What' s new in Capsa 7.8
VoIP Analysis
Capsa 7.8 provides a VoIP analysis module to capture and analyze VoIP calls and graphically display VoIP analysis results, which helps IT staff baseline and troubleshoot VoIP-based networks.
A VoIP view is provided to list all VoIP calls as well as their related statistics and has a lower pane for analyzing voice and video control flows and media flows as well as their jitter, loss, MOS, etc., to visualize analysis data and assess voice and video quality.
A VoIP Explorer groups private and public IP addresses for VoIP calls.
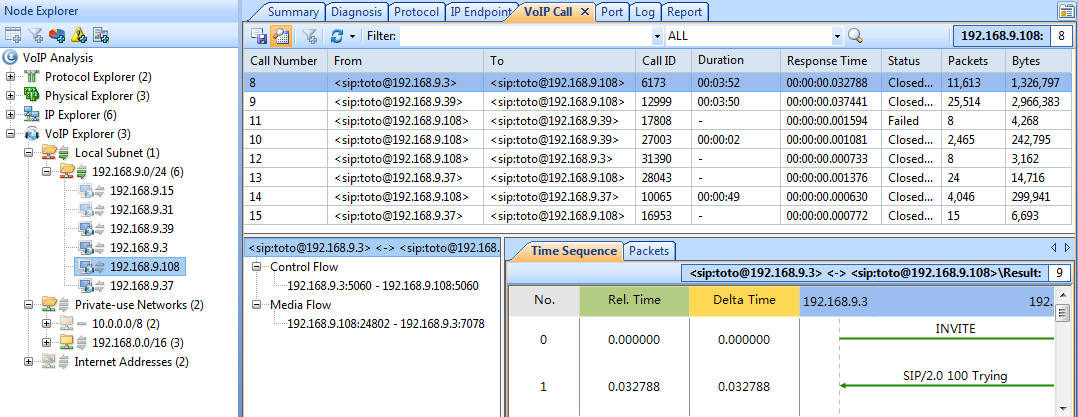
Furthermore, there are VoIP diagnosis events and VoIP logs. A VoIP dashboard contains the VoIP analysis charts graphically.
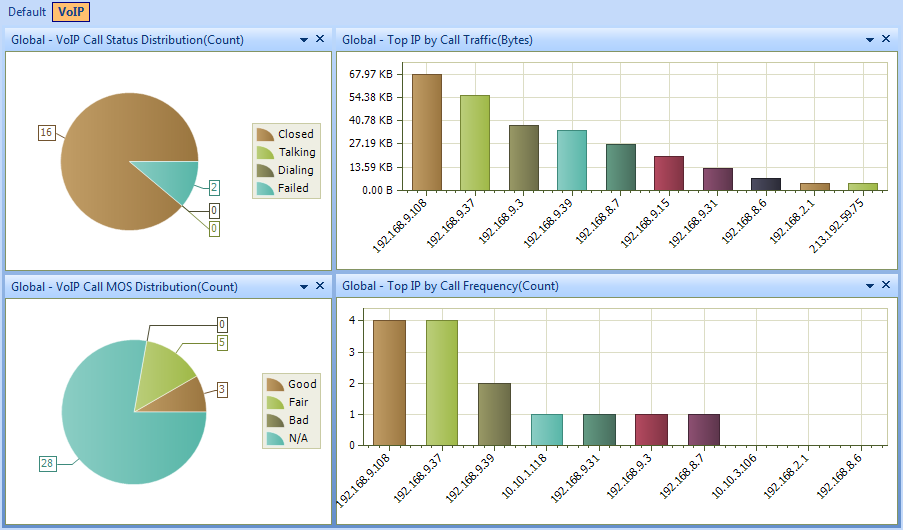
Together with VoIP Explorer and VoIP diagnosis, the VoIP view helps users visualize analysis data and assess voice and video quality, to thereby assist you troubleshooting VoIP networks, software and hardware.
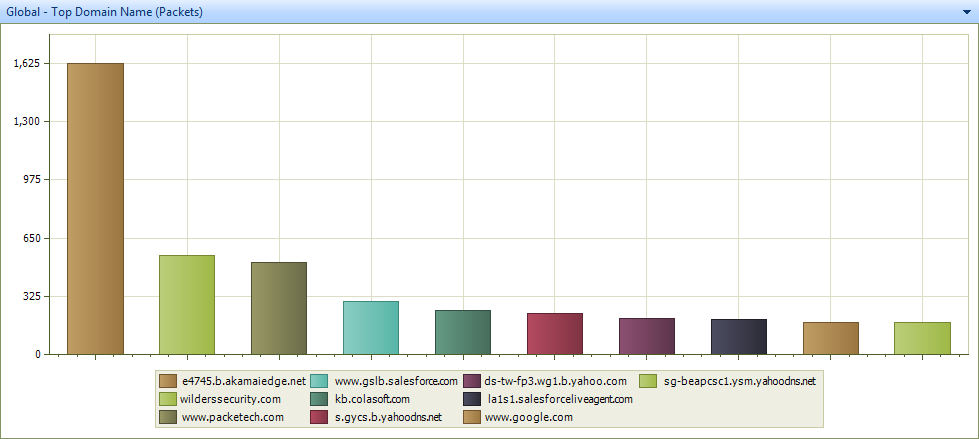
Top Domain Name Statistics
Earlier versions of Capsa provide a Name Table feature to help network administrators conveniently manage staff's network activities by displaying the IP address as names instead of figures. Capsa 7.8 here now provides a top domain feature which shows top visited Internet IP addresses as domain names. We know that one domain name may be resolved to be multiple IP addresses, and Capsa can identify all these IP addresses as one domain name if they are actually directed to that domain, and graphically display the top resolved domain names:
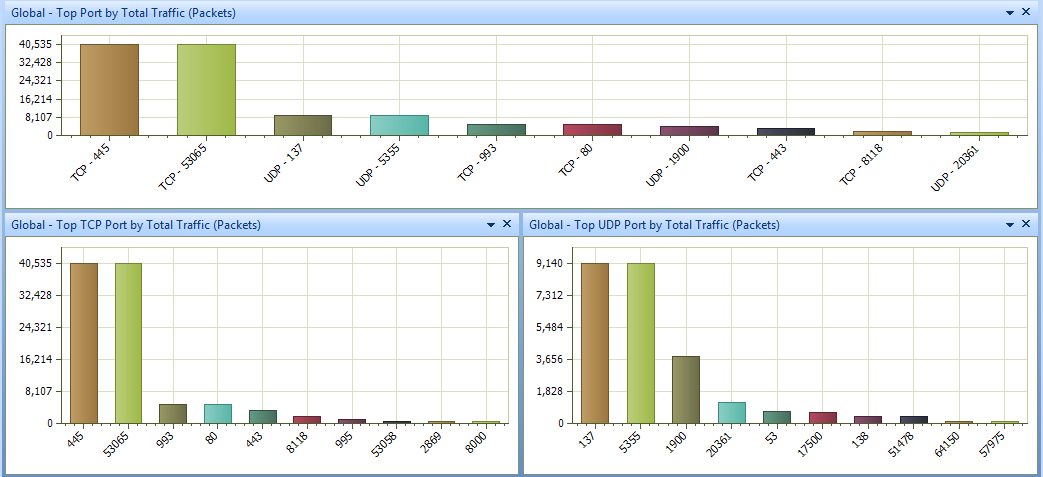
Port - Based Statistics
A Port view is provided to present traffic statistics based on TCP/UDP port numbers. This feature is useful when you want to analyze a specific application. The port numbers are provided with above layer protocol, packets, bytes, average packet size, and common application.
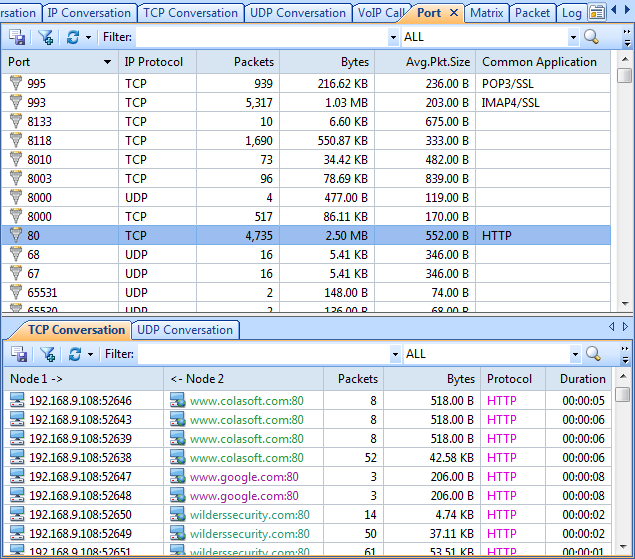
In addition, the Dashboard view provides a Port panel to graphically display top port statistics: