Chapter 3 - Network Link - Start Monitoring Session
- What are the components of Colasoft nChronos
- How and where to install nChronos Server and Console software
- How to login and activate nChronos Server
Before heading into this lesson, please make sure you fully understand these questions. If not, you are recommended to go back to take a look at last lesson again, or you can email us for help with your specific need.
In this lesson we will learn how to start a link analysis. First, we should take a look at this term - Network Link. A network link is defined as a logical link which collects and analyzes packets from one or multiple network interface cards. We can simply consider the network link as a Project. Now let's see how to start a link analysis. Before starting a link analysis, we need to make some link configurations.
Log to Server from a browser
- You can log into nChronos Server from the browser. To log into a Server from a browser, follow the steps below:
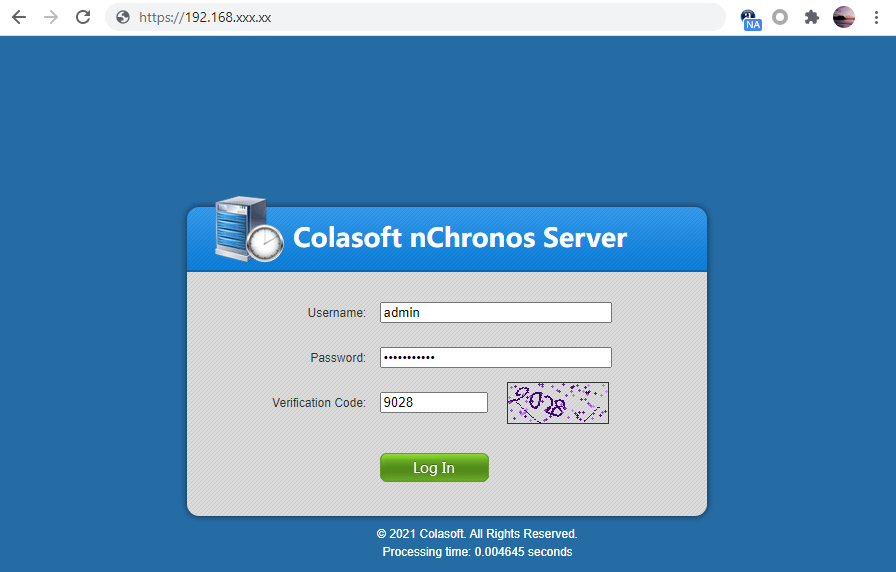
- Launch a browser, in the address bar input https://xxx.xxx.xxx.xxx (xxx.xxx.xxx.xxx stands for the IP address of the nChronos server) and then press ENTER. The IP is the IP address of the management interface of nChronos Server. On nChronos Server login portal, input the user name admin and the password D&^4Vs!(, and then press ENTER.
- Click Log In to log in the Server.
Configure Storage Settings
You should further configure the storage space to store data.
- To allocate the storage space,
- Login the Server from a browser.
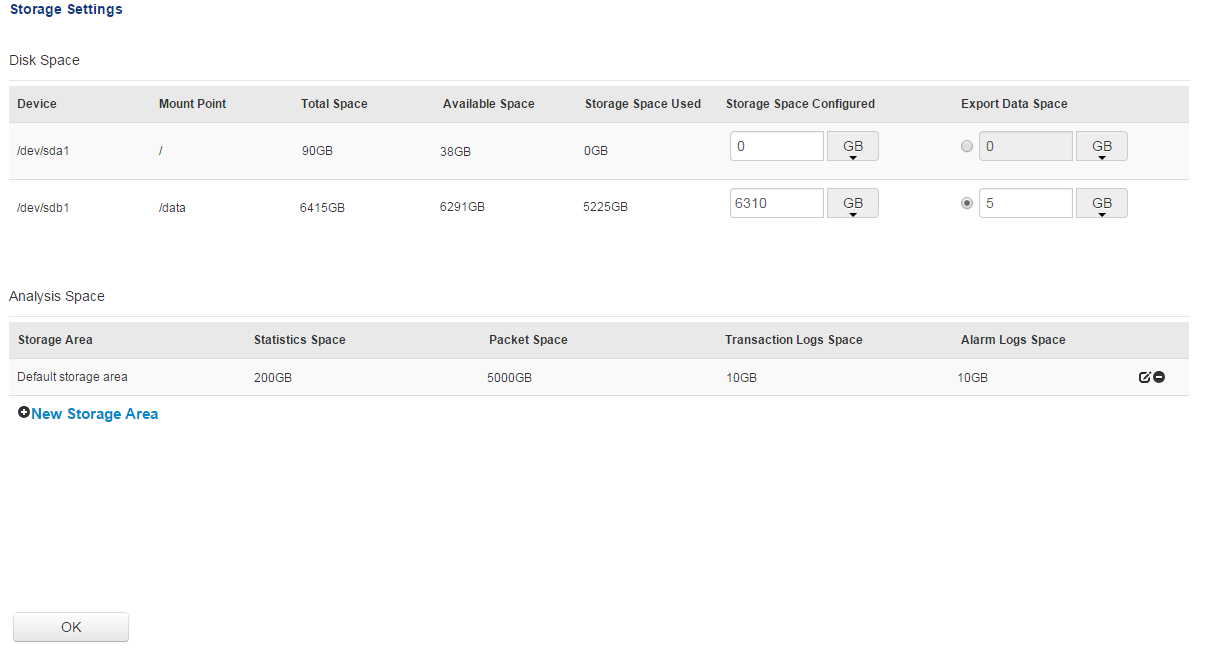
- Click Storage Settings on the left navigation bar to get into the Storage Settings page:
- Enter an integer for the Storage Space Configured box to set the space for storing nChronos Data.
- Click New Storage Area to create a storage area
- Click OK to save settings.
Configure Interface
The nChronos Server requires at least two network interfaces on the server machine, one works as the Management interface and the others work as Capture interface. The Capture interfaces are for capturing traffic and delivering it to nChronos Server, while the Management interface is for nChronos Console communicating with nChronos Server.
- To specify the capture interface and the management interface,
- Login the Server from a browser.
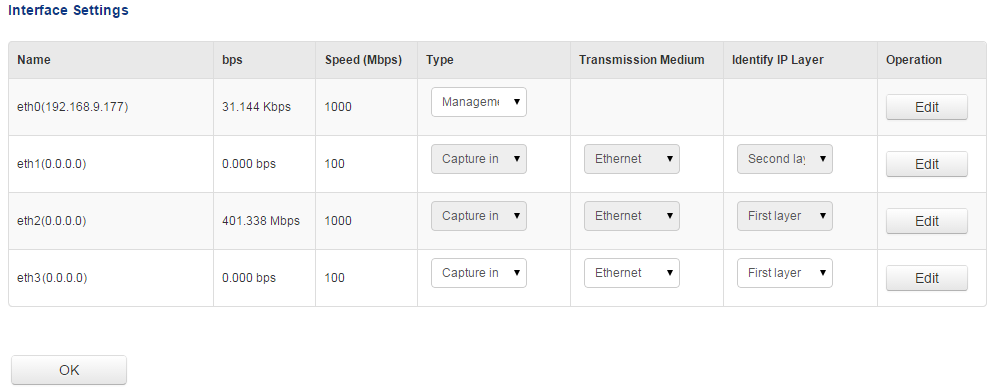
- Click Interface Settings on the left navigation bar to get into the Interface Settings page, which lists all available adapters:
- Under the Type column, select an appropriate interface type for the adapters.
- Click OK to save the settings.
After specifying the Capture interface and the Management interface, if you need to modify the settings of the Management interface, follow the steps below:
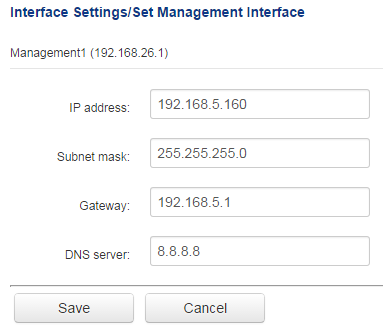
- Click Edit following the Management interface to get into the setup page, like the following figure:
- Enter the IP address, subnet mask, gateway, and DNS server address, and then click Save.
- If you need to set up a virtual capture interface, just click the Edit button following the capture interface to go to the Virtual Interface page, and then set up a virtual interface.
Add a Network link
- To add a network link, follow the steps below:
- Login the Server from a browser.
- Click Link Configuration on the left navigation bar to get into the Link Configuration page
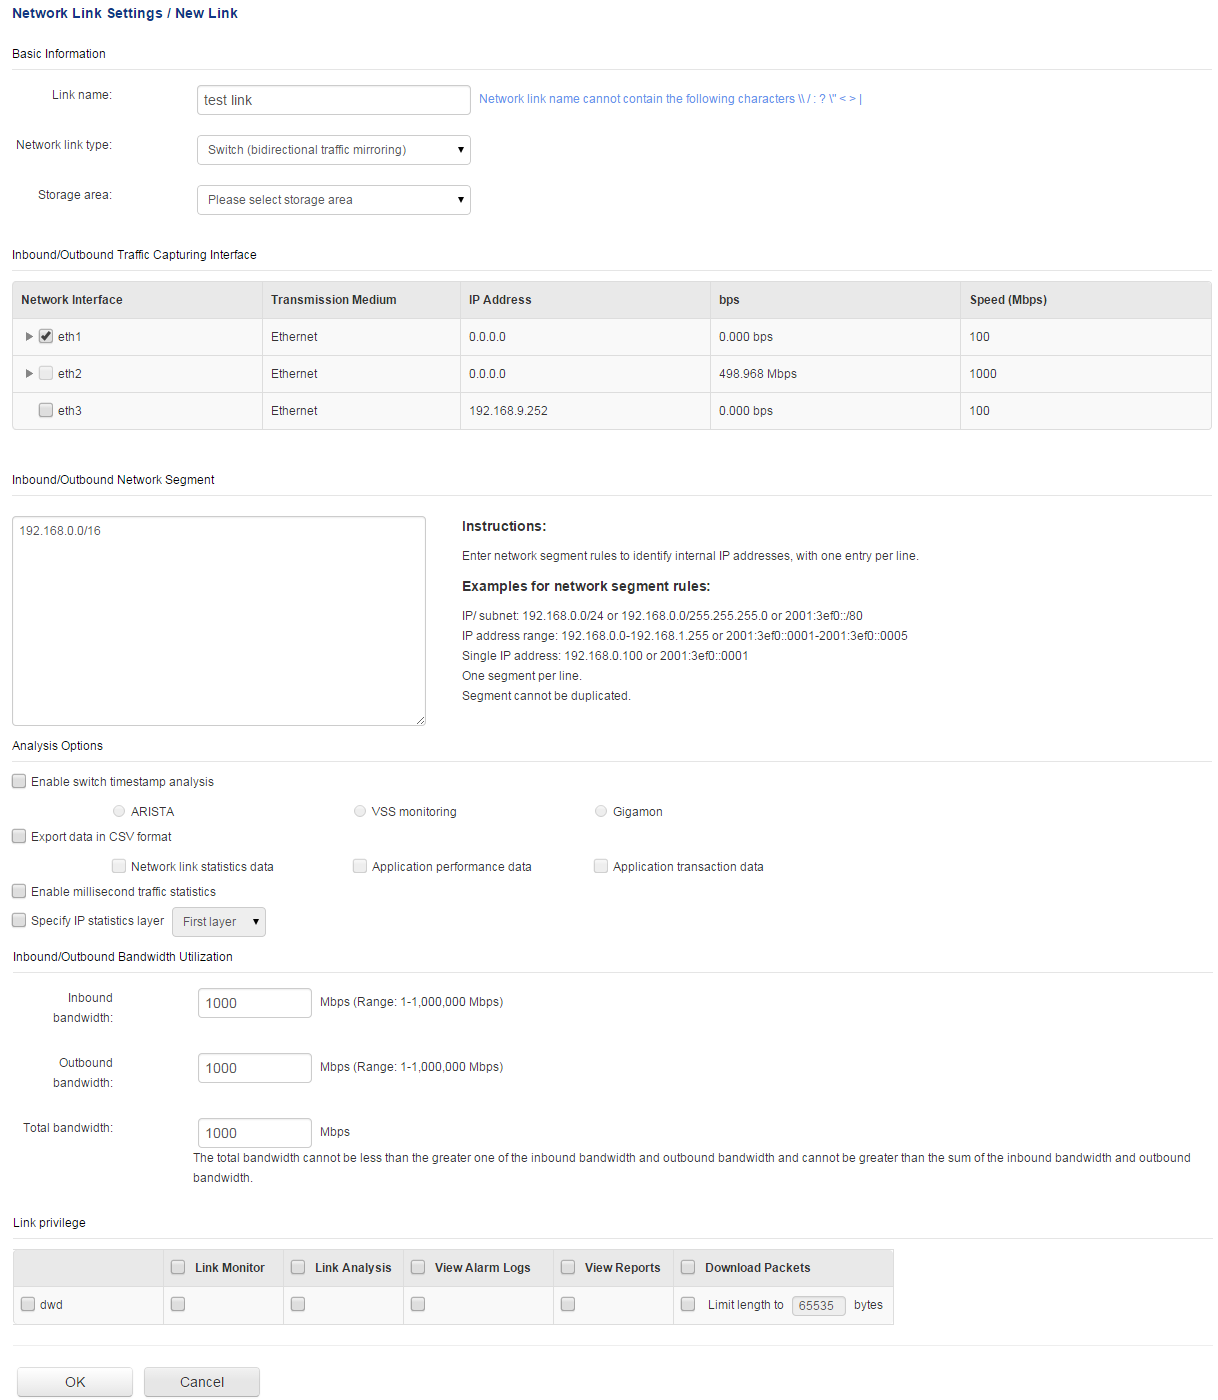
- Click New Link to show the following page:
- Enter the link name and select a link type. The following list describes the link types.
- Switch (mirrored bidirectional traffic): nChronos captures traffic from the switch which has mirrored traffic, including inbound and outbound.
- Switch (mirrored unidirectional traffic): nChronos captures traffic from the switch which has mirrored one-way traffic, inbound or outbound.
- Standard tap: A network tap which only mirrors one-way traffic, inbound or outbound.
- Aggregation tap: A network tap which mirrors bidirectional traffic, including inbound and outbound.
- Select a storage area for the network link. The data of multiple network links can be stored on one storage area.
- Set capture interface and network segments: If you select Switch (mirrored bidirectional traffic) or Aggregation tap, follow the steps below:
- Select the capture interfaces which are connected with the mirror port of the switch or the tap.
- Set the network segment, which is for identifying the transmission direction of the packets to further get accurate inbound and outbound traffic statistics. You should enter the IP addresses and the segments that should be recognized as internal addresses.
- Select the capture interfaces that are connected with the outbound mirror port of the switch or the tap for capturing outbound traffic.
- Select the capture interfaces that are connected with the inbound mirror port of the switch or the tap for capturing inbound traffic.
- Set up whether to use switch timestamp, whether to export data, whether to enable millisecond analysis.
- Set bandwidth. Enter the inbound bandwidth, outbound bandwidth, and the total bandwidth. You should type the actual bandwidth to get accurate bandwidth utilization.
- Click OK to complete the network link.
Run a Network Link
To monitor real-time network data from the Console side, get the analysis statistics of the network traffic, or download packets from the Server, you must first run the link.
To run a network link, just click the button Run on the Link Configuration page.