Chapter 5 - Console User Interface Introduction
- How to connect to a nChronos server from Console
- How to troubleshoot connection error issues
Before heading into this lesson, please make sure you fully understand these questions. If not, you are recommended to go back to take a look at last lesson again, or you can email us for help with your specific need. The biggest advantage of this retrospective network analysis product is that we can either have a long term or short term view on our network running status, and we can choose to look into a specific period of time.
By default, the trend chart shows traffic stats of past 1 second and we can see the traffic utilization, packet count, and traffic volume of each second. If we change the window size to 1-day, each scale on the trend chart represents a day, and the statistics are the sum of each day. The bigger the window size value, the more resources are required on the server to retrieve and analyze the statistic data.
Time Window
The following list describes the icon buttons on the Time Window.
 : These icon buttons are for setting the time range of the Time Window.
 : Click corresponding time scale to select a time window type.
 : Click this icon to select a data type to display.
You can drag the Time Window to view network data of past time range. To drag the Time Window, move your mouse on the time scales of the charts, and drag when the mouse becomes .
.
You can choose to set the Time Window or to set the selected time range.
- Click
 and select Set Time Window. The Set Time Window dialog box appears.
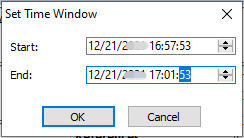
- Set the start time in the Start field and set the end time in the End field.
- Click OK.
Select a Time Range
The analysis views below the Time Window display the data of selected time range on the Time Window.
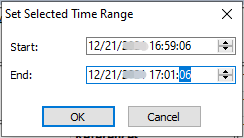
You can drag the handles to widen or narrow the time range.