Chapter 6 - Move Trend Chart & Select Time Range
- The user interface and components of the stat view
- How to select time range
In this lesson we will take a look at the user interface of nChronos Console. The nChronos Console is the component that we use to monitor the real time network performance, view network analysis stats, perform drill-down analysis, etc. When we start the nChronos Console, the Start Page will show up. One the Start Page, we can find the latest official news, product tips, and the contact information. If we add a server connection (more details on last lesson) on the Server Explorer (left-side panel), we can connect to the server, and it opens the stats view. The view contains a trend chart and several stats views.
The Trend Chart
With the trend charts, we are able to have a graphical view of traffic trends. It helps us identify when the traffic drops and when climbs more visually than just numbers, and then we can focus on the abnormal time period to see what happened during that period closely. So it is often the starting point where we start out retrospective and drill-down analysis. By default, the time window shows the traffic trend of past four minutes. When we change or move the time window, the chart refreshes automatically. We can zoom in to time unit of second and zoom out to day, which means if we have a 4-minute time window we can view traffic stats of every second, while 7-month window shows stats of each day.
If we are interested in looking into a specific time period, we can click and drag to select a time span on the trend chart to view traffic statistics of that period. By selecting a time span on the trend chart, the views down below displays only the statistics of that time period, it helps us focus on only that small slice of time. For example, we are reported that users cannot access the webserver at about 7:00 AM to 7:15 AM, and we need to figure out the causes of this downtime. Now we can connect to nChronos server, and rewind back to the time window of that period, select time period between 7:00 - 7:15 AM. And the views will refresh to show the traffic statistics during those 15 minutes. Then we can use the drill-down feature to focus on analyzing the webserver address, and check the data link layer, Internet layer, and its TCP transports.
Statistic Views
There are several views below the trend chart which display types of statistics in different tabs. They work together with trend charts and time span selection to reduce statistic data volumes and let us focus on analyzing and drill-down to look into network issues. The views are described below:
There are several analysis views to display the statistics in different types. They work together with trend charts and time range selection on it to reduce statistic data volumes and let you focus on analyzing and drilldown to look into network issues.
Icon Buttons on the toolbars of the views
- There is a toolbar on the top of each analysis view and the same buttons on different toolbars have the same functions.
- The following list describes some buttons on the toolbar.
 : Downloads packets of current time range. For more information about downloading packet, see Download Packets dialog box in this section.
 : Launches the Expert Analyzer to analyze the packets of selected time range.
 : Saves the current statistical list as a .csv file. For more information about exporting statistics, see Export Statistics dialog box in this section.
 : Click to generate a temporary report based on the statistics on the current view.: Click to generate a graph based on the statistics on the current view. Click the icon again to close the graph back to list data.
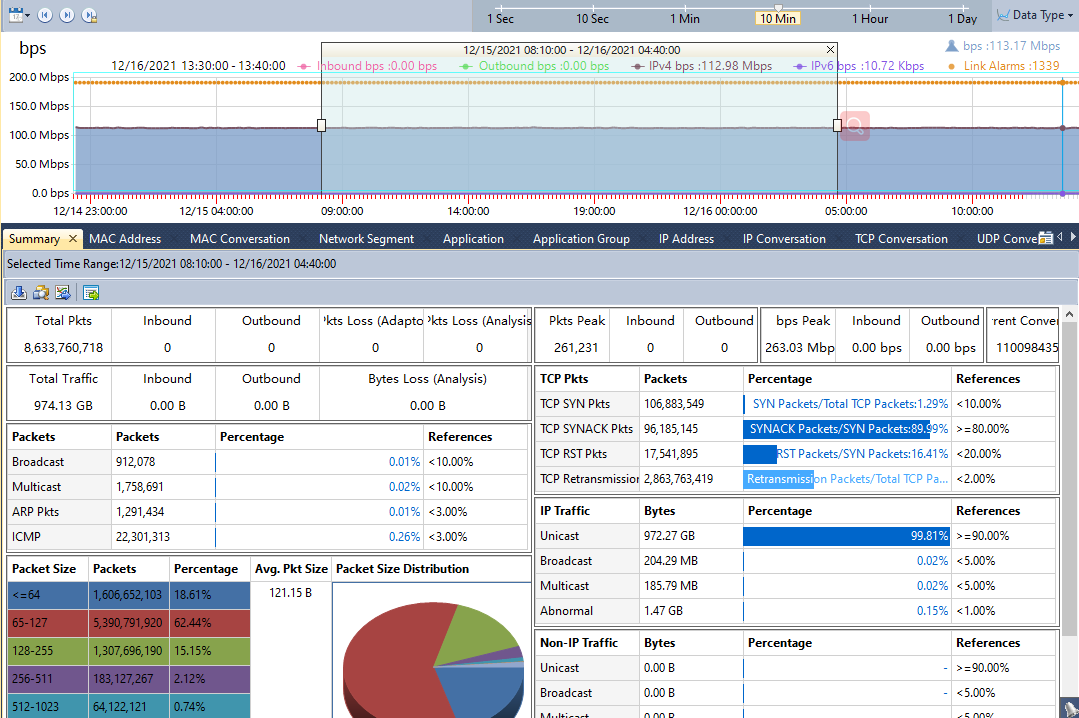
The Summary view
The Summary view provides overall summary statistics of alarms, utilization, traffic, packets and TCP packets of selected time range on the trend chart.
The MAC Address view
The Physical Address view displays the traffic of the network according to MAC addresses, as well as bytes, and packets. Right-click the column header and click the appropriate column, then you can view the statistics in the form of other statistical fields.
The MAC Conversation view
The Physical Conversation view displays the traffic of the network according to physical communication nodes, as well as node bytes, and packets.
The Network Segment view
The Network Segment view provides the statistics and analysis of the traffic according to network segments which are defined when configuring the network link.
The Network Segment Group view
The Network Segment Group view displays the statistics of network segment groups which are defined when configuring the network link.
The Application view
The Application view provides statistics of network applications, including system applications and custom applications. The system applications are uploaded to the library when configuring the Server at the Server side and the custom applications can be customized when configuring network link at the Console side. The custom applications have priority over the system applications.
The Application view displays the traffic of the network according to applications name, as well as bytes, packets, and average packet size. Right-click the column header and click the appropriate column, then you can view the statistics in the form of other statistical fields.
The Application Group view
The Application Group view displays network traffic statistics based on application groups which are defined when configuring the network link.
The IP Address view
The IP Address view provides the statistics and analysis of the traffic according to IP addresses. By default, this view displays the statistics of internal IP. You can click External IP to view the statistics of external network.
The IP Address view displays the traffic of the network according to IP addresses, as well as bytes, packets, and average packet size. Right-click the column header and click the appropriate column, then you can view the statistics in the form of other statistical fields.
The IP Conversation view
The TCP Conversation view displays the traffic of the network according to communication nodes, as well as node geographic location, port number, application, round-trip time, bytes, packets, and average packet size.
The UDP Conversation view
The UDP Conversation view displays the traffic of the network according to communication nodes, as well as node geographic location, port number, application, bytes, packets, and average packet size.
The Segment-Segment view
The Segment-Segment view provides the statistics and analysis of the traffic according to network segments which are defined when configuring the network link.
The Service Access view
The Service Access view displays application access statistics of the monitored network link, including server/client IP, service port number, application, traffic, and TCP packets.
The Port view
The Port view includes two tabs: TCP Service Port and UDP Service Port, displaying port access statistics based on IP address + port number.
The Service Port view
The Service Port view displays port access statistics based on IP address + port number. Right-click the column header and click the appropriate column, then you can view the statistics in the form of other statistical fields.
The Link Alarms view
The Link Alarms view displays the link alarm logs according to alarm types which include traffic alarm, email alarm, domain alarm, and signature alarm. All link alarm logs are listed with trigger time, alarm category, alarm name, severity, and trigger condition, etc.
The Virtual Network view
The Virtual Network view displays virtual network statistics based on ID. Right-click the column header and click the appropriate column, then you can view the statistics in the form of other statistical fields.
The DSCP view
The DSCP view displays network traffic statistics based on DSCP markings.
The views above mentioned, except the Summary view, will have records displayed only when you select a time span on the trend chart. And when you change the selection of the time span, the statistics on the views will refresh automatically. And you can select records in the views and right-click to select drill-down analysis, by this way, you are able to focus on specific network objects and find the source of what you want.
So far, we can see that nChronos console user interface is clear and simple to understand and we are going to talk about how to use the console program in next lesson.