Contact Us
Customer Portal
Capsa provides a VoIP analysis module to capture and analyze VoIP calls and graphically display VoIP analysis results, which helps IT staff baseline and troubleshoot VoIP-based networks.
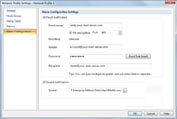
Capsa will now send an email to your email box, and/or play sound, when an alarm is triggered. When you are out of office, this function will make sure you are timely notified when there is something going wrong on your network.
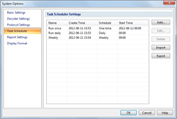
Task scheduler provides the ability to run packet capture and analysis at pre-defined time automatically, which can be scheduled to run one time, daily or weekly.
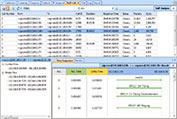
TCP packets reveal useful information to help us troubleshoot slow network, especially for the cases like slow website response, slow CRM transactions and slow downloading or uploading, etc.
Accurately detects DoS (DDoS) attack, Worm activity, ARP attack, TCP port scanning and suspicious conversation and locates the source and target in real-time.
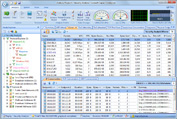
Monitors Network traffic and Network bandwidth details in graphs and numbers.
Being able to support more than 300 protocols, Capsa make it easy to analyze protocols in network and understand what is happening.
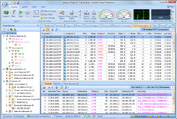
Capsa captures all network packets transmitted on network and displays detailed packet decoding information in Hex, ASCII and EBCDIC.
Monitors HTTP, Email, DNS, FTP, MSN and Yahoo! Messenger.
Lists all hosts in network with details (traffic, IP, MAC, etc.).
Automatically diagnoses network problems and suggests solutions.
Visualizes the entire network in an ellipse, showing connections and traffic.
Monitors all conversations and reconstruct packet stream.
Free built-in tools to create and replay packets; scan and ping IPs.
Quickly generates reports of most concerned items.